ANZ-Roy Morgan Consumer Confidence drops 4.6pts to 91.2 as nation faces a jump in fuel prices – lowest since September 2020
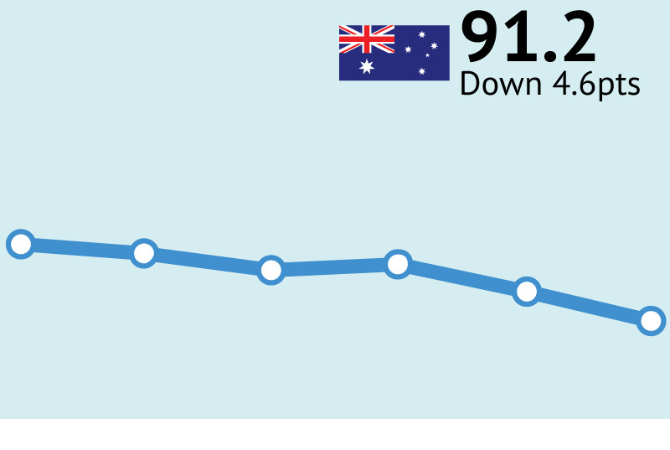
ANZ-Roy Morgan Consumer Confidence dropped 4.6pts to 91.2 during the third week of March. Consumer Confidence is a significant 19.7pts below the same week a year ago, March 20/21, 2021 (110.4) and is now clearly below the 2022 weekly average of 99.7. Consumer Confidence is now at its lowest since Victoria’s second wave of COVID-19 on September 5/6, 2020 (91.1).
Driving the weekly drop were declines in sentiment in regards to personal financial situations and also the performance of the economy over the next year.
Current financial conditions
- Now just 23% (down 3ppts) of Australians say their families are ‘better off’ financially than this time last year compared to 36% (up 1ppt), that say their families are ‘worse off’ financially (the highest figure for this indicator for over 18 months since September 2020).
Future financial conditions
- Looking forward, 33% (down 3ppts) of Australians expect their family to be ‘better off’ financially this time next year (the lowest figure for this indicator for 18 months since September 2020), compared to just 26% (up 2ppts) that expect to be ‘worse off’ financially (the highest figure for this indicator for nearly two years since April 2020).
Current economic conditions
- Only 9% (down 3ppts), of Australians expect ‘good times’ for the Australian economy over the next twelve months (the lowest figure for this indicator for nearly 18 months since October 2020) compared to 34% (up 5ppts), that expect ‘bad times’ (the highest figure for this indicator for nearly 18 months since October 2020).
Future economic conditions
- In the longer term, just 16% (up 1ppt), of Australians are expecting ‘good times’ for the economy over the next five years compared to 21% (unchanged) expecting ‘bad times’.
Time to buy a major household item
- Buying intentions have deteriorated with 32% (down 3ppts) of Australians, saying now is a ‘good time to buy’ major household items while 40% (up 4ppts) say now is a ‘bad time to buy’ (the highest figure for this indicator for over 18 months since August 2020).
ANZ Head of Australian Economics, David Plank, commented:

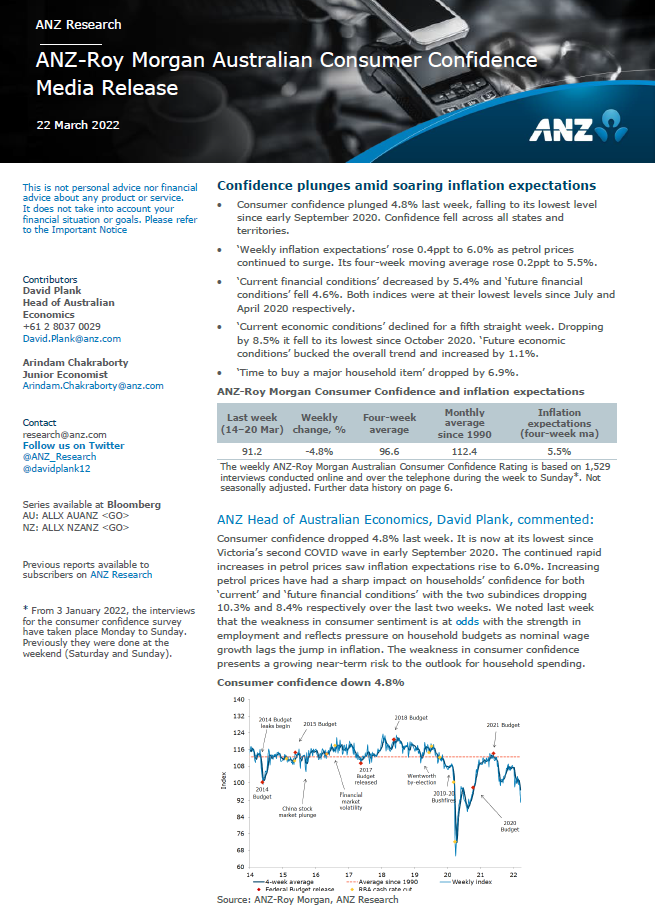
Consumer confidence dropped 4.8% last week. It is now at its lowest since Victoria’s second COVID wave in early September 2020. The continued rapid increases in petrol prices saw inflation expectations rise to 6.0%. Increasing petrol prices have had a sharp impact on households’ confidence for both ‘current’ and ‘future financial conditions’ with the two subindices dropping 10.3% and 8.4% respectively over the last two weeks. We noted last week that the weakness in consumer sentiment is at odds with the strength in employment and reflects pressure on household budgets as nominal wage growth lags the jump in inflation. The weakness in consumer confidence presents a growing near-term risk to the outlook for household spending.”
Related Research Reports
The latest Roy Morgan Consumer Confidence Monthly Report is available on the Roy Morgan Online Store. It provides demographic breakdowns for Age, Sex, State, Region (Capital Cities/ Country), Generations, Lifecycle, Socio-Economic Scale, Work Status, Occupation, Home Ownership, Voting Intention, Roy Morgan Value Segments and more
Consumer Confidence – Monthly Detailed Report in Australia.
Business Confidence – Monthly Detailed Report in Australia.
Consumer Banking Satisfaction - Monthly Report in Australia.
For comments or more information please contact:
Roy Morgan - Enquiries
Office: +61 (03) 9224 5309
askroymorgan@roymorgan.com
Margin of Error
The margin of error to be allowed for in any estimate depends mainly on the number of interviews on which it is based. Margin of error gives indications of the likely range within which estimates would be 95% likely to fall, expressed as the number of percentage points above or below the actual estimate. Allowance for design effects (such as stratification and weighting) should be made as appropriate.
| Sample Size | Percentage Estimate |
| 40% – 60% | 25% or 75% | 10% or 90% | 5% or 95% | |
| 1,000 | ±3.0 | ±2.7 | ±1.9 | ±1.3 |
| 5,000 | ±1.4 | ±1.2 | ±0.8 | ±0.6 |
| 7,500 | ±1.1 | ±1.0 | ±0.7 | ±0.5 |
| 10,000 | ±1.0 | ±0.9 | ±0.6 | ±0.4 |
| 20,000 | ±0.7 | ±0.6 | ±0.4 | ±0.3 |
| 50,000 | ±0.4 | ±0.4 | ±0.3 | ±0.2 |