Meal delivery services double usage in only 18 months

New research from Roy Morgan shows nearly 4 million Australians aged 14+ (19.1%) now use meal delivery services, up from 1.98 million (9.8%) when Roy Morgan first analysed the emerging meal delivery service industry in mid-2018.
The biggest increases have been amongst the youngest generations. Well over a quarter of Millennials 29.7% (up 13.6% points) and 28.7% (up 15.5% points) of Generation Z now use meal delivery services. In contrast only 4.7% of Pre-Boomers use the services, an increase of 1.1% points.
Women are more likely to use meal delivery services (20.5%) than men (17.6%). However in the 25-34 year age group more men (33.3%) than women (32.8%) use meal delivery services. Women are more likely to use the services in all other age groups.
City-dwellers (23.9%) are far more likely to have had their meals delivered than those in country areas (10%) and Sydney (25.8%) just pips Melbourne (25.6%) as the leading city for meal delivery services.
UberEATS remains the market leader and is now used by 11.5% of Australians including over 1-in-5 in Generation Z. Other leading meal delivery services such as Menulog, Deliveroo and HelloFresh have also seen significant increases in usage of their services since mid-2018.
Roy Morgan CEO Michele Levine explains that the rapid growth in the usage of meal delivery services over the last 18 months shows the convenience of using apps for everyday services is finding favour with an increasing number of Australians and setting the stage for more creative innovation:
“Roy Morgan has closely monitored the usage of apps over the last few years and the rapid take-up of meal delivery service apps since UberEATS and Deliveroo launched in mid-2015 is no surprise. “Uber overtook the taxis as the preferred private transport service in mid-2019 and with only a fifth of Australians now using meal delivery services there is still plenty of room to grow usage. Already the younger generations of Millennials (29.7% usage) and Generation Z (28.7%) are approaching market penetration of a third.
“The success of these apps in creating massive new markets has implications for other industries as well. I recently discussed with Daily Mail Australia the impact new package delivery service Amazon Flex will likely have:
'Clearly (Amazon Flex) represents a threat to Australia Post and other delivery services such as DHL Express focused on delivering packages ordered online, which has boomed over the last decade. Australia Post runs the risk of being left with the expensive and unprofitable deliveries. e.g. for rural and regional areas, bulky packages, and special deliveries.'
“Younger Australians, and many enterprising older people as well, have quickly taken to the convenience of apps available in the palm of one’s hand to streamline the use of everyday services and remove the friction that many had probably never even considered.
“This dynamic of innovation and the increasing ease-of-use for accessing services is itself creating further momentum to innovate and find new goods and services that are suited to the disruption a well-designed app can provide to remake an industry to cater for time-poor or impatient consumers.”
Australians used meal delivery services by Generation – September 2019 cf. March 2018
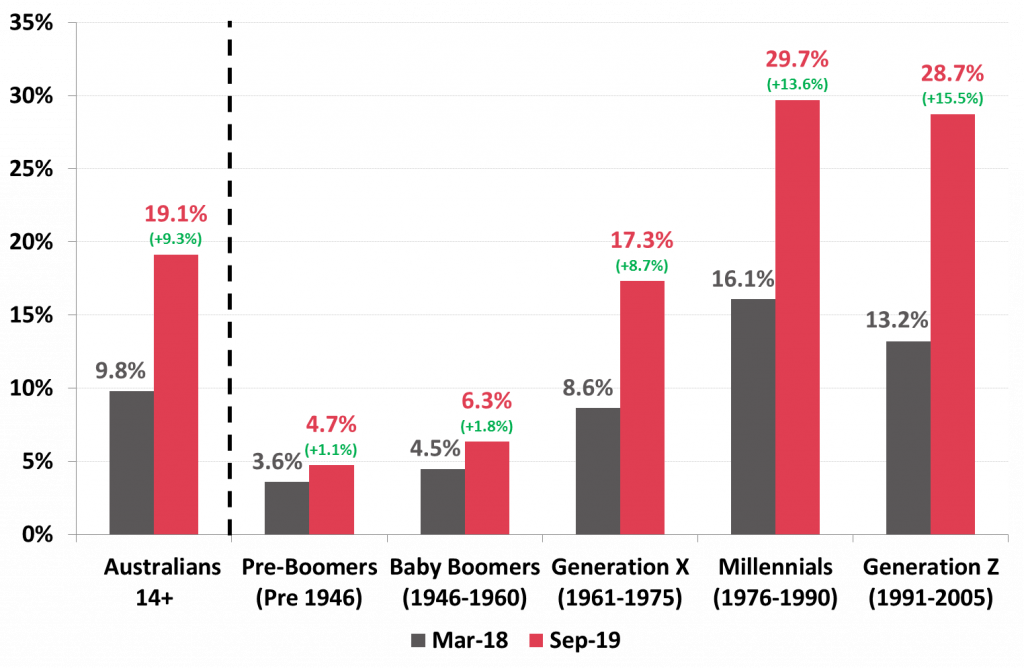
Source: Roy Morgan Single Source: April 2017 – March 2018, n = 15,067 & Oct. 2018 – Sept. 2019, n=13,744. Base: Australians aged 14+.
View our range of Meal Delivery Services Customer Profiles.
For comments or more information please contact:
Roy Morgan - Enquiries
Office: +61 (03) 9224 5309
askroymorgan@roymorgan.com
Margin of Error
The margin of error to be allowed for in any estimate depends mainly on the number of interviews on which it is based. Margin of error gives indications of the likely range within which estimates would be 95% likely to fall, expressed as the number of percentage points above or below the actual estimate. Allowance for design effects (such as stratification and weighting) should be made as appropriate.
| Sample Size | Percentage Estimate |
| 40% – 60% | 25% or 75% | 10% or 90% | 5% or 95% | |
| 1,000 | ±3.0 | ±2.7 | ±1.9 | ±1.3 |
| 5,000 | ±1.4 | ±1.2 | ±0.8 | ±0.6 |
| 7,500 | ±1.1 | ±1.0 | ±0.7 | ±0.5 |
| 10,000 | ±1.0 | ±0.9 | ±0.6 | ±0.4 |
| 20,000 | ±0.7 | ±0.6 | ±0.4 | ±0.3 |
| 50,000 | ±0.4 | ±0.4 | ±0.3 | ±0.2 |