Australia & COVID-19 The Economic Story So Far – August 2020

What do the key indicators tell us about 2020 so far?
During the COVID-19 crisis, the ANZ-Roy Morgan Consumer Confidence Index, Roy Morgan Business Confidence Index and Inflation Expectations all hit new record lows and Unemployment reached its highest level since Roy Morgan began independently measuring it more than two decades ago.
Clearly, many unenviable records have been set as Australia deals with the COVID-19 pandemic. But there have been hopeful signs amid the gloom.
Government and business turn to Roy Morgan for key measures on Consumer Confidence, Business Confidence, Inflation Expectations and real Unemployment.
Here’s how events unfolded:
- On January 22 Australia had its first confirmed case of COVID-19.
- On March 19 Australia closed international borders.
- On March 22 the JobSeeker payment was doubled for six months, part of a $66 billion stimulus package which also allowed those under financial duress to draw down their superannuation.
- On March 23 cafes, restaurants, pubs and clubs around the country closed, except for takeaway.
- On March 28 a daily diagnosis peak was reached, with 469 new cases confirmed.
- On March 30 the $130 billion JobKeeper package was announced, to run to September 27.
- On July 21 details of amended JobSeeker and JobKeeper packages were released, with the latter running from the original September 2020 end date to March 2021.
- On August 2 Victorian Premier Daniel Andrews announced Melbourne would enter a Stage 4 lockdown that week running until at least mid-September to combat a renewed outbreak.
By March 15, 60% of businesses told us they had already been affected by COVID-19.
On March 28/29, the ANZ-Roy Morgan Consumer Confidence Index bottomed out at 65.3
— lower even than during the Global Financial Crisis, and far below the 2019 average of 114.0.
In April, the Roy Morgan Business Confidence Index plummeted to an all-time low of 76.9
— the 2019 average was 109.0.
BUT…
Boosted by the government’s economic support measures announced in late March and the flattening infection curve, Consumer Confidence rose steadily throughout April and May, recovering to 98.3 by May 30/31.
This rise stalled in June and, following a surge of new cases in Melbourne at the end of that month, it dropped to 93.0 by the end of June — 25.9 points lower than the same period a year earlier and 1.8 points below the 2020 weekly average of 94.8.
Further cases in Victoria and NSW, and a renewed Stage 3 lockdown in Melbourne, led Consumer Confidence to continue falling, to a low of 86.5 nationally by August 8/9 and only 81 in Melbourne and 85.1 in Sydney. However there has been one standout with Consumer Confidence in Perth spending most of July in positive territory above 100.
The first signs of renewed optimism in Victoria, and Australia, came through in mid-August when Consumer Confidence registered its first increase for over two months on August 15/16 increasing by 2.1pts to 88.6. This increase was driven by increases in Melbourne, Sydney, Adelaide and Perth after the number of new cases of COVID-19 in Victoria peaked ten days earlier on August 5.
Business Confidence bounced back following its April low, reaching 95.0 in June nationally including 110.5 in WA and 100.7 in NSW. However, the new outbreaks in Victoria and NSW caused an immediate dip with Business Confidence falling to only 84.3 in July.
While there have been positive signs among the Consumer and Business Confidence figures, the unemployment picture is grim no matter how you look at it.
In July, Roy Morgan figures showed unemployment was at 12.5% and a further 10.5% of the workforce was under-employed. That’s 3.28 million Australians who were either looking for work or wanting more work, even before Melbourne went into a new harsher lockdown in August.
Tracking movement in the Sydney and Melbourne CBDs revealed just how hard hit businesses there have been. Mobile devices numbers revealed that the number of people coming into Sydney CBD in in the first week of July was down 47% compared to January and February. Things were even worse in Melbourne — even before the resumption of Stage 3 lockdown, CBD visits were down 61%. In the week ending August 8, the first week of Melbourne’s Stage 4 lockdown, movement in the CBD plunged to a new record low of just 17% of pre-COVID times.
The huge economic effects of COVID-19 on business and employment are reflected in Roy Morgan’s Inflation Expectations index — a way of ‘reading the national room’ on feelings about the economy. In February, before the pandemic really took hold in Australia, consumers on average expected 4% inflation over the next two years. In June, Inflation Expectations hit a record low of 3.2% before rebounding to 3.4% in July.
[See below for charts presenting all this data in visual form].
What does it all mean, and where to from here?
Roy Morgan CEO Michele Levine says:
“We’re not out of the woods on COVID-19, not by a long way. Australia responded quickly and decisively to the threat of the pandemic. Because of that the number of people infected and lives lost has been kept far lower than elsewhere in the world. However, there is no room for complacency, as shown by the renewed outbreaks in Victoria and NSW.
“In response to the second wave of COVID-19 which began in June, an unprecedented Stage 4 lockdown has been enforced in Melbourne since early August. The lockdown includes an 8pm curfew for residents of the city, mandatory mask-wearing and additional restrictions that force Melburnians not to venture more than 5km from their homes for shopping or exercise.
“Many businesses in Melbourne that were struggling to get back on their feet are now in lockdown again as the state tries to prevent widespread transmission. This virus has already caused enormous damage to lives and livelihoods and the danger is far from over.
“Our figures show a staggering 3.28 million Australians were either unemployed or under-employed in July — this includes more than 1 million people who were working prior to COVID-19. And we have not hit bottom yet. The government stepped in quickly with JobKeeper, keeping millions more people in work. Currently being paid to 3.5 million workers via 960,000 employers, it is serving as a safety net, masking the true extent of unemployment.
“JobKeeper was originally set to last until the end of September. Thankfully the federal government understood the importance of keeping it running, albeit in amended form, giving businesses the time to find their feet in the ‘new normal’ of a world with COVID-19. Doing so puts money in people’s pockets and gives both consumers and businesses confidence that together we can find a way through.
“However, even when it is necessary, any social engineering of this nature has unforeseen consequences. Many questions arise following the announcement on the immediate future of JobKeeper and JobSeeker. These include whether some businesses might arrange things to ensure an income drop so they continue to qualify for JobKeeper; what the effect will be on businesses and workers who no longer qualify for the scheme; and whether the government will agree to sustained calls for a permanent increase in the payment now known as JobSeeker rather than a reversion to its previous (Newstart) level.
“The Economic and Fiscal Update announced by Treasurer Josh Frydenberg in late July not only confirmed the continuing support to various sectors of the economy as Australia battles the pandemic but also outlined some of the costs. Australia’s Federal Budget deficit for 2019/20 ended up at a massive $86 billion – despite original forecasts of a Budget surplus. Going forward, the Budget deficit for 2020/21 is set to balloon to well over $180 billion – the largest since World War II.
“Looking forward Employment, Consumer Confidence and Business Confidence are the most critical measures signalling the economic recovery from the ongoing crisis. Roy Morgan will continue to do the important work of tracking this data and making the results publicly available, as we have done for 80 years. In addition, we have created the Roy Morgan Recovery Dashboard for businesses who want to closely track these vital metrics in an easy to use, adaptable format and to drill down further.
“We’re here for business and the nation as a whole, just as we have always been.”
Key charts tracking the Economic Impact of COVID-19
Businesses affected by the COVID-19 coronavirus - March 2020 cf. February 2020

Source: Roy Morgan SMS surveys on February 11-13, 2020, n=1,170 and March 13-15, 2020, n=1,148.
Base: Australian businesses.
Roy Morgan Business Confidence Rating: 2010-2020

Source: Roy Morgan Business Single Source, Dec 2010-July 2020. Average monthly sample over the last 12 months=1,132.
ANZ-Roy Morgan Consumer Confidence Rating: 1998-2020

Source: Roy Morgan Single Source, January 1998 – July 2020. Average weekly sample over the last 12 months=1,160.
Roy Morgan & ABS Unemployment & Under-employment: January 2019 – July 2020
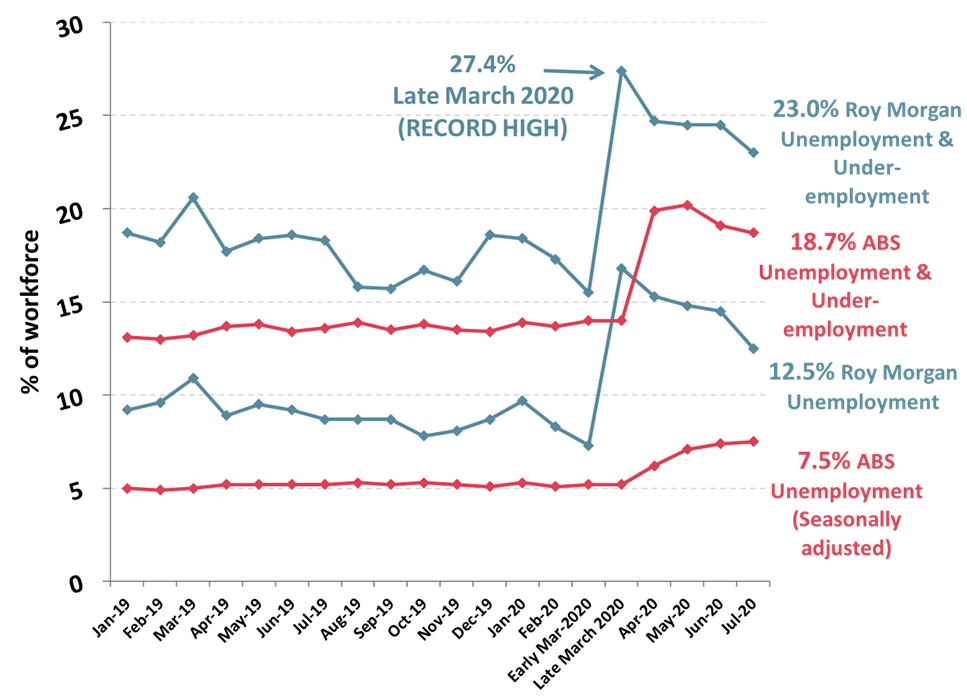
Source: Roy Morgan Single Source, January 2019 – July 2020, Average monthly sample size, n=4,400. Base: Australians 14+.
Roy Morgan-Uber Media Analysis of Movement Data in 2020 – Sydney CBD
tableau
Source: Roy Morgan collaboration with UberMedia who provide anonymous aggregated insights using mobile location data.
Note: Movement data for Sydney CBD excludes residents of the Sydney CBD.
Roy Morgan-Uber Media Analysis of Movement Data in 2020 – Melbourne CBD
t
Source: Roy Morgan collaboration with UberMedia who provide anonymous aggregated insights using mobile location data.
Note: Movement data for Melbourne CBD excludes residents of the Melbourne CBD.
For comments or more information please contact:
Roy Morgan - Enquiries
Office: +61 (03) 9224 5309
askroymorgan@roymorgan.com
Margin of Error
The margin of error to be allowed for in any estimate depends mainly on the number of interviews on which it is based. Margin of error gives indications of the likely range within which estimates would be 95% likely to fall, expressed as the number of percentage points above or below the actual estimate. Allowance for design effects (such as stratification and weighting) should be made as appropriate.
| Sample Size | Percentage Estimate |
| 40% – 60% | 25% or 75% | 10% or 90% | 5% or 95% | |
| 1,000 | ±3.0 | ±2.7 | ±1.9 | ±1.3 |
| 5,000 | ±1.4 | ±1.2 | ±0.8 | ±0.6 |
| 7,500 | ±1.1 | ±1.0 | ±0.7 | ±0.5 |
| 10,000 | ±1.0 | ±0.9 | ±0.6 | ±0.4 |
| 20,000 | ±0.7 | ±0.6 | ±0.4 | ±0.3 |
| 50,000 | ±0.4 | ±0.4 | ±0.3 | ±0.2 |