Donation Deflation: Australian trends in charity

Australians are historically renowned for helping their mates, and when it came to donations to charity this had still rung true. However, Roy Morgan has explored the trends and patterns of Australian donations to charity and have discovered a worrying trend; the proportion of Australians who donate annually has fallen, and the quantity donated has stagnated.
As of March 2018, 61% of Australians aged 14 and over reported giving to charity at least once over the past 12 months, a total of 12.3 million Australians. This is a steep drop from our September 2011 figure of 70%, and the follow-up September 2015 figure of 66%. Where previous falls had been offset with a higher average value of donations over the 12 month period (keeping the total donated amount steady), the March 2018 average annual amount given by donors of $469 is barely higher than the September 2015 figure ($462).
The state with the largest proportion of donors was Victoria (62.9%), followed closely by NSW/ACT (61.8%).
Australian Donors by State – March 2018
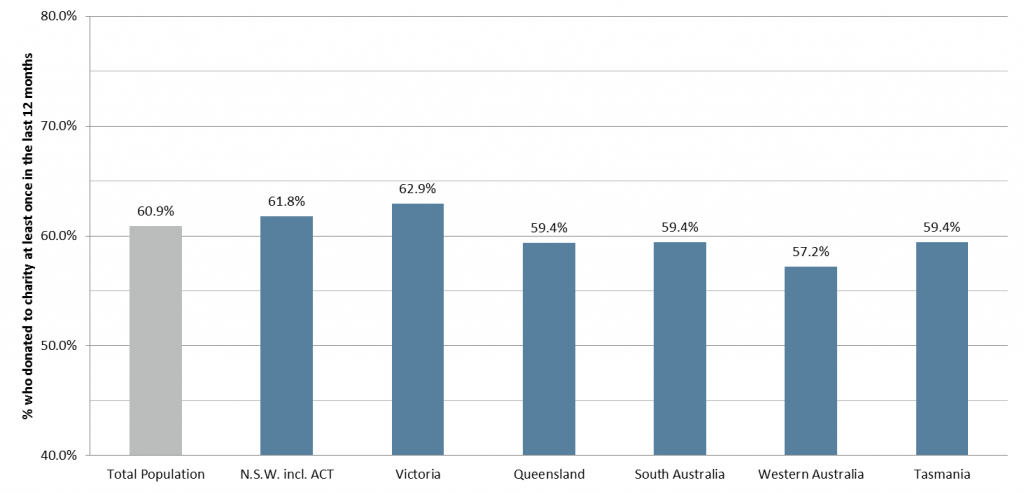
Source: Roy Morgan Single Source Australia, April 2017 - March 2018, Base: Australians aged 14+. n=15,067.
The state with easily the largest average annual donations by donors was NSW ($550), followed by Western Australia ($467) and Victoria ($423).
Since September 2015 there has been a reduction of donations from Western Australian residents. They had previously been the home of the largest proportion of Australian donors (71%), but now Western Australia has the lowest proportion of any state (57.2%), a 14ppts fall in under 3 years. The average annual amount given has also dropped dramatically in Western Australia, down from $518 in September 2015 to $467 in March 2018.
Michele Levine, CEO, Roy Morgan, says:

“Unfortunately for charities across Australia, the pool of potential donors they compete for is shrinking quickly, and while historically this has been counterbalanced by increased dollars donated, this doesn’t seem to be the case anymore.
“This drop in total donors coincides with a fall in the percentage of Western Australian residents who donate any amount within 12 months. In previous years they were the most charitable state, however our updated data reveals that Western Australians have not been as generous with their donation spending in the 2017/18 period.
“It’s vital for any business, including charities and Not-For-Profits, to keep up to date with their customer base and understand who donates and who doesn’t. This trend in Western Australia then begs the question; what causes such dramatic changes in donation behaviour, where total donor numbers and donation value can fall significantly over a few years?
“One possibility is that the current state of the mining industry of Western Australia, having become a shadow of its former glory, has taken its toll on the average family’s budget. This would explain the drop in Western Australian donations we see in our data. If this is the case, however, there is hope for charities around Australia still. Mining operations in Western Australia are back on the rise, and with them consumer confidence, company profits, and disposable income for charitable Aussie families may well be imminent.
“When it comes to charity spending, there are multiple indicators which can help charities understand changes in consumer behaviour, allowing them to refine their strategies and make the most of the generosity of over 12 million Australians who donated within the last 12 months.”
For comments or more information please contact:
Roy Morgan - Enquiries
Office: +61 (03) 9224 5309
askroymorgan@roymorgan.com
Margin of Error
The margin of error to be allowed for in any estimate depends mainly on the number of interviews on which it is based. Margin of error gives indications of the likely range within which estimates would be 95% likely to fall, expressed as the number of percentage points above or below the actual estimate. Allowance for design effects (such as stratification and weighting) should be made as appropriate.
| Sample Size | Percentage Estimate |
| 40% – 60% | 25% or 75% | 10% or 90% | 5% or 95% | |
| 1,000 | ±3.0 | ±2.7 | ±1.9 | ±1.3 |
| 5,000 | ±1.4 | ±1.2 | ±0.8 | ±0.6 |
| 7,500 | ±1.1 | ±1.0 | ±0.7 | ±0.5 |
| 10,000 | ±1.0 | ±0.9 | ±0.6 | ±0.4 |
| 20,000 | ±0.7 | ±0.6 | ±0.4 | ±0.3 |
| 50,000 | ±0.4 | ±0.4 | ±0.3 | ±0.2 |