Australia’s 12 million public transport users face a COVID19 dilemma – get back on the train or drive to work?

Over 12 million Australians aged 14+ (58%) use public transport in an average three months. Trains are the most popular form of public transport used by 9.2 million (44%) ahead of buses used by 8 million (38%) and trams used by 3.4 million (16%).
The onset of the COVID-19 pandemic in recent months has raised new questions about the safety of mass transit systems as Australians start returning to a more normal work-life experience as restrictions are gradually eased.
Many have suggested the public transport systems in Australia’s largest cities are already over-loaded and usage of public transport does correlate to population size.
Nearly 3.4 million Sydneysiders use public transport, equal to 76% of the city’s population, and over 3 million Melburnians (71% of the population) use public transport.
After these two large cities there is a substantial drop-off in public transport usage to Brisbane – 1.2 million (59%), Perth – 1 million (60%) and Adelaide – 660,000 (59%). Only 100,000 residents of Hobart use public transport representing just over half (52%) of the city’s population.
Usage of public transport is fairly similar for both women (56%) and men (59%).
Analysis by generation shows a clear correlation between age and how likely someone is to use public transport with 3.4 million Australians in the youngest generation, Gen Z* (72%), using public transport.
Over 3 million Millennials* (60%) use public transport, 2.6 million in Gen X* (53%), 2.3 million Baby Boomers* (51%) and 770,000 Pre-Boomers* (42%).
Roy Morgan CEO Michele Levine says adhering to social distancing guidelines on Australia’s packed public transport systems introduces new questions about where we work and how we get to work:

“Australia has handled the COVID-19 pandemic in an exemplary fashion thus far with the enforced lockdowns reducing the spread of the virus and potentially saving tens of thousands of lives. In March there were predictions that close to 100,000 Australians could die from COVID-19 under a ‘worst-case’ scenario. The current toll from the virus stands at just 0.1% of this level at just over 100.
“However, the success in suppressing the virus without eliminating it completely introduces a new dilemma for Australians returning to work over the next few weeks and months. Do they continue working from home or return to work in the office with potentially millions of other Australians?
“Over 12 million Australians use public transport in an average three months – and this includes over 3 million in both Sydney and Melbourne. The packed nature of public transport in peak hour is well-known to anyone who has been used to catching trains, trams and buses to work.
“It is practically impossible to follow social distancing guidelines on peak hour public transport and this raises the question of alternatives such as continuing to work from home, companies staggering working hours for different employees or finding a safer means of transport such as driving into work.
“Although Australia’s car industry has endured some of the weakest months in its history in March and April the prospect of people returning to work seeking the safer option of driving to work does raise hopes for a quicker than expected rebound for the industry in the second-half of 2020.“
*Generations: Pre-Boomers (born pre-1946); Baby Boomers (born 1946-1960); Gen X (born 1961 - 1975); Millennials (born 1976 - 1990); Gen Z (born 1991 - 2006).
Public transport use in Australia by Gender & Generation – March 2020
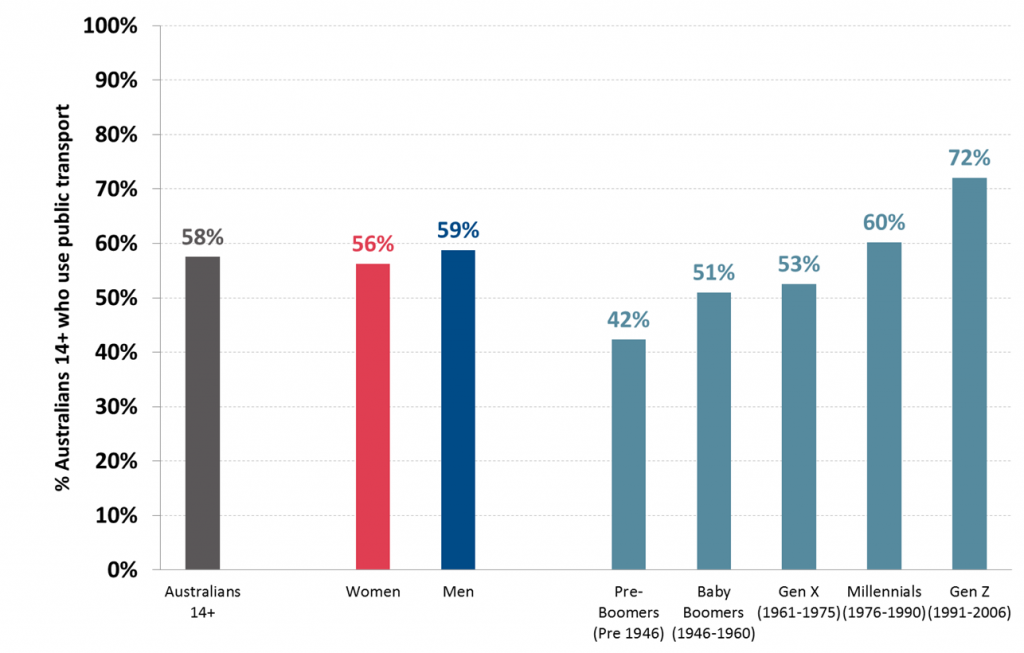
Source: Roy Morgan Single Source, April 2019 – March 2020, sample n = 13,208. Base: Australians aged 14+.
This new data comes from Roy Morgan Single Source, Australia’s most comprehensive consumer survey, derived from in-depth interviews with over 50,000 Australians each year.
View our range of Public Transport User Profiles.
For comments or more information please contact:
Roy Morgan - Enquiries
Office: +61 (03) 9224 5309
askroymorgan@roymorgan.com
Margin of Error
The margin of error to be allowed for in any estimate depends mainly on the number of interviews on which it is based. Margin of error gives indications of the likely range within which estimates would be 95% likely to fall, expressed as the number of percentage points above or below the actual estimate. Allowance for design effects (such as stratification and weighting) should be made as appropriate.
| Sample Size | Percentage Estimate |
| 40% – 60% | 25% or 75% | 10% or 90% | 5% or 95% | |
| 1,000 | ±3.0 | ±2.7 | ±1.9 | ±1.3 |
| 5,000 | ±1.4 | ±1.2 | ±0.8 | ±0.6 |
| 7,500 | ±1.1 | ±1.0 | ±0.7 | ±0.5 |
| 10,000 | ±1.0 | ±0.9 | ±0.6 | ±0.4 |
| 20,000 | ±0.7 | ±0.6 | ±0.4 | ±0.3 |
| 50,000 | ±0.4 | ±0.4 | ±0.3 | ±0.2 |