Betta is best, according to furniture and electrical buyers

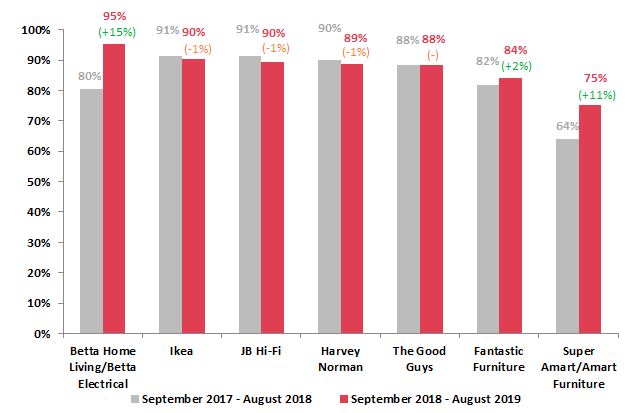
Betta Home Living/Betta Electrical has continued its remarkable rise in customer satisfaction ratings. The franchised retail chain is Australia’s leading furniture and electrical retailer for the third month in a row. Its August 2019 customer satisfaction rating of 95% is up a full 15% from a year ago.
In joint second place are IKEA and JB Hi-Fi, which each have customer satisfaction ratings of 90%, both down 1% point from a year ago.
Closely bunched behind them are Harvey Norman, on 89% — also down 1% from last year — and The Good Guys, maintaining the previous year’s customer satisfaction score of 88%.
These findings come from from the Roy Morgan Single Source survey, in-depth face-to-face interviews with over 50,000 Australians each year in their homes.
“Competition in the furniture and electrical store market is fierce,” says Roy Morgan CEO Michele Levine. "Betta Home Living/Betta Electrical and JB Hi Fi both have multiple monthly wins for customer satisfaction this year, three and four respectively. The last few months of the year will be crucial for both retailers as they attempt to claim the overall customer satisfaction award for 2019.”
Among retailers outside the top 5, Super Amart/Amart Furniture also experienced an impressive increase, up 11% points to reach a customer satisfaction of 75%.
Who shops where: Betta vs IKEA
While all of the retailers rated sell furniture and electrical appliances, Roy Morgan research shows their differing price-points, ranges and brand promises appeal to very different types of consumers.
Women do the majority of the shopping at Betta Home Living/Betta Electrical, and nearly half its customers are aged 50 or over. They tend to be looking for part-time work or involved in home duties, with an average annual income of $28,000. They are heavy commercial TV watchers, with nearly 40% watching more than three hours a day, and sport fans, with more than three-quarters having watched sport on TV in the past three months. In contrast, over 40% of these customers have not been to a cinema in the past year.
In terms of the insights provided by Roy Morgan Values Segments, matching Australians’ stated values and behaviours with their consumer profiles, one-in-three Betta Home Living/Betta Electrical Customers is from the Traditional Family Life segment: ‘Traditional family values are important to them, as are sensible consumer choices. Not comfortable with change, they opt for familiarity and trustworthiness when spending their hard-earned dollars.’
As a group, IKEA shoppers are very different.
The average IKEA customer is aged 25 to 49, firmly in Gen Y. She is likely to be married, with a personal income over $62,000 and household income of nearly $140,000. She is more likely than the average Australian to agree with the statements “I was born to shop” and “I will buy a product because of the label”. She is also more likely to read women’s fashion magazines. In terms of the Roy Morgan Values Segments, she is likely to be classified as a Young Optimist or Socially Aware: ‘She’s conscious of the image she projects and wants to make the right impression. She’s a long-term thinker, and busy planning her career and thinking about the future’
Roy Morgan Furniture/Electrical Store Customer Satisfaction August 2019

Source: Roy Morgan Single Source Australia, September 2017 – August 2018, n=14,985 and September 2018 – August 2019. n=14,005. Base: Australians 14+.
Roy Morgan Customer Satisfaction Awards
The Roy Morgan Customer Satisfaction Awards highlight the winners but this is only the tip of the iceberg. Roy Morgan tracks customer satisfaction, engagement, loyalty, advocacy and NPS across a wide range of industries and brands. This data can be analysed by month for your brand and importantly your competitive set.
Need to know what is driving your customer satisfaction?
For comments or more information please contact:
Roy Morgan - Enquiries
Office: +61 (03) 9224 5309
askroymorgan@roymorgan.com
Margin of Error
The margin of error to be allowed for in any estimate depends mainly on the number of interviews on which it is based. Margin of error gives indications of the likely range within which estimates would be 95% likely to fall, expressed as the number of percentage points above or below the actual estimate. Allowance for design effects (such as stratification and weighting) should be made as appropriate.
| Sample Size | Percentage Estimate |
| 40% – 60% | 25% or 75% | 10% or 90% | 5% or 95% | |
| 1,000 | ±3.0 | ±2.7 | ±1.9 | ±1.3 |
| 5,000 | ±1.4 | ±1.2 | ±0.8 | ±0.6 |
| 7,500 | ±1.1 | ±1.0 | ±0.7 | ±0.5 |
| 10,000 | ±1.0 | ±0.9 | ±0.6 | ±0.4 |
| 20,000 | ±0.7 | ±0.6 | ±0.4 | ±0.3 |
| 50,000 | ±0.4 | ±0.4 | ±0.3 | ±0.2 |
