95% of Australians stand by ‘Aussie-made’ as support for US products plummets since Trump’s inauguration
New Roy Morgan research shows Australians remain overwhelmingly committed to buying Australian-made products, with support sitting at a consistent 95%. In contrast, attitudes toward products from the United States and China have shifted dramatically since 2020.
In the first 6 months of the year, Australians’ likelihood of buying USA made products has plunged 14% points to 40%, coinciding with Donald Trump’s return to the White House in January 2025. This marks the lowest level recorded in the 25 years since Roy Morgan began tracking USA product sentiment in 2005. During the Biden administration, positive sentiment towards USA made products climbed to a high of 60% in mid-2023, but has since declined.
In contrast, Australians’ willingness to buy Chinese-made products has steadily increase over the last few years and has now reached 34%, almost double the level recorded at the start of the pandemic (18%). Chinese made products have shown near consistent growth, particularly over the past quarter (up 5% points).
Roy Morgan interviewed a representative cross section of 346,149 Australians aged 14+ from April 2020 to June 2025. Respondents were asked to indicate whether they would be more likely or less likely to buy products made in each of the following countries: Australia, Canada, Chile, China, France, Germany, India, Indonesia, Italy, Japan, Korea, Malaysia, New Zealand, Singapore, South Africa, Spain, Sweden, Thailand, UK, USA and Vietnam.
% of Australians who are ‘more likely’ to buy products made in Australia, USA and China
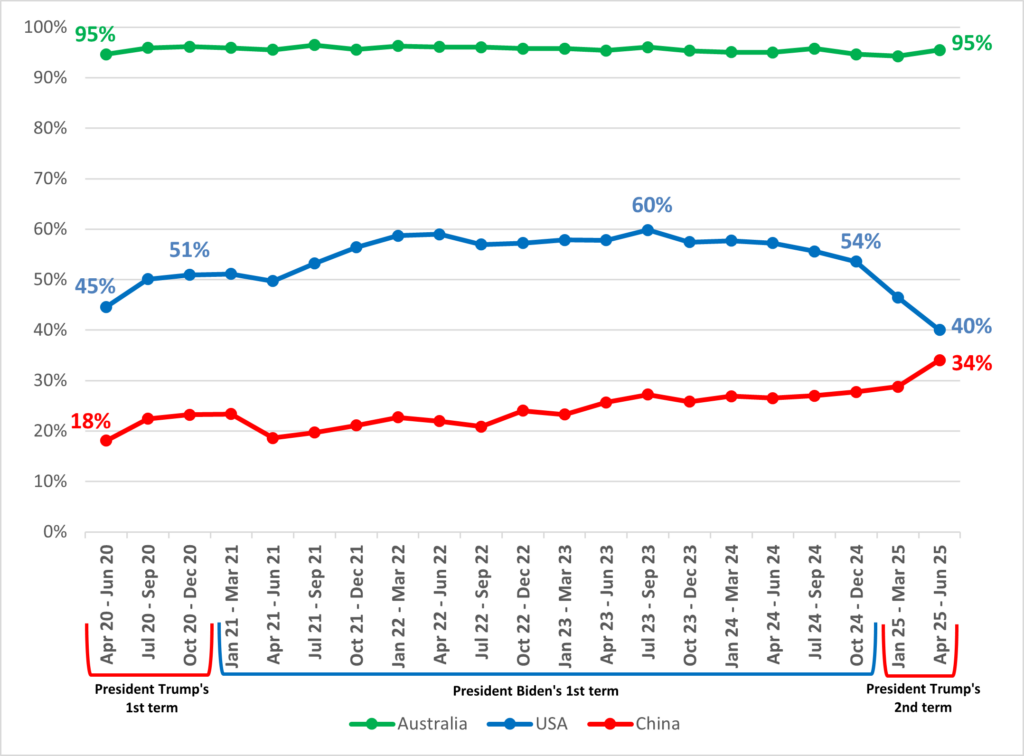
Source: Roy Morgan Single Source (Australia). Base: Australian, aged 14+ between April 2020 to June 2025, average interviews per quarter (n=16,483), total: (n=346,149).
Roy Morgan CEO Michele Levine says:

“Australians’ preference for Australian-made is unshakable, with consistently high (95%) more likely to buy locally made products.
“However, international preferences have shifted sharply. During the Biden administration, US made goods enjoyed a surge in favour to as high as 60% of Australians, but that has now evaporated with Trump’s re-election, down 14% points since his inauguration (from 54% to only 40%).
“In contract, China has been on a slow but steady path of improvement, albeit from a very low base. Now over 1 in 3 (34%) Australians are more likely to buy Chinese made products, almost doubling since the pandemic (18%).
“These shifts underline how geopolitics and leadership matter in shaping consumer attitudes.”
For comments or more information about Roy Morgan’s data please contact Andrew Calvert-Jones or Julian McCrann for more details.
Question: "Please indicate below whether you would be more likely or less likely to buy products made in each country listed"
Reports available for sale:
The latest Roy Morgan data is available on the Roy Morgan Online Store. It provides demographic breakdowns for Age, Sex, State, Region (Capital Cities/ Country), Generations, Lifecycle, Socio-Economic Scale, Work Status, Occupation, Home Ownership, Voting Intention, Roy Morgan Value Segments, Helix Personas, Media Consumption, and more.
Roy Morgan offers in-depth profiles on consumer attitudes toward products from 21 countries.
Related Research:
About Roy Morgan
Roy Morgan is Australia’s largest independent Australian research company, with offices in each state, as well as in the U.S. and U.K. A full-service research organisation, Roy Morgan has over 80 years’ experience collecting objective, independent information on consumers.
Margin of Error
The margin of error to be allowed for in any estimate depends mainly on the number of interviews on which it is based. Margin of error gives indications of the likely range within which estimates would be 95% likely to fall, expressed as the number of percentage points above or below the actual estimate. Allowance for design effects (such as stratification and weighting) should be made as appropriate.
| Sample Size | Percentage Estimate |
| 40% – 60% | 25% or 75% | 10% or 90% | 5% or 95% | |
| 1,000 | ±3.0 | ±2.7 | ±1.9 | ±1.3 |
| 5,000 | ±1.4 | ±1.2 | ±0.8 | ±0.6 |
| 7,500 | ±1.1 | ±1.0 | ±0.7 | ±0.5 |
| 10,000 | ±1.0 | ±0.9 | ±0.6 | ±0.4 |
| 20,000 | ±0.7 | ±0.6 | ±0.4 | ±0.3 |
| 50,000 | ±0.4 | ±0.4 | ±0.3 | ±0.2 |