Australians holiday overseas for a shorter time

In 2002 when Australians went overseas for a holiday the average time they spent was over a month (31.9 days to be precise) but by March 2019 this has reduced markedly down to just over three weeks (21.6 days). These are the latest figures from Roy Morgan’s State of the Nation – Tourism presentation.
The average length of domestic holidays taken has remained relatively stable during this time consistently around 6 days on average. This data is based on in-depth interviews conducted face-to-face with over 50,000 consumers per annum in their homes.
Average Length of Time Spent on Holiday
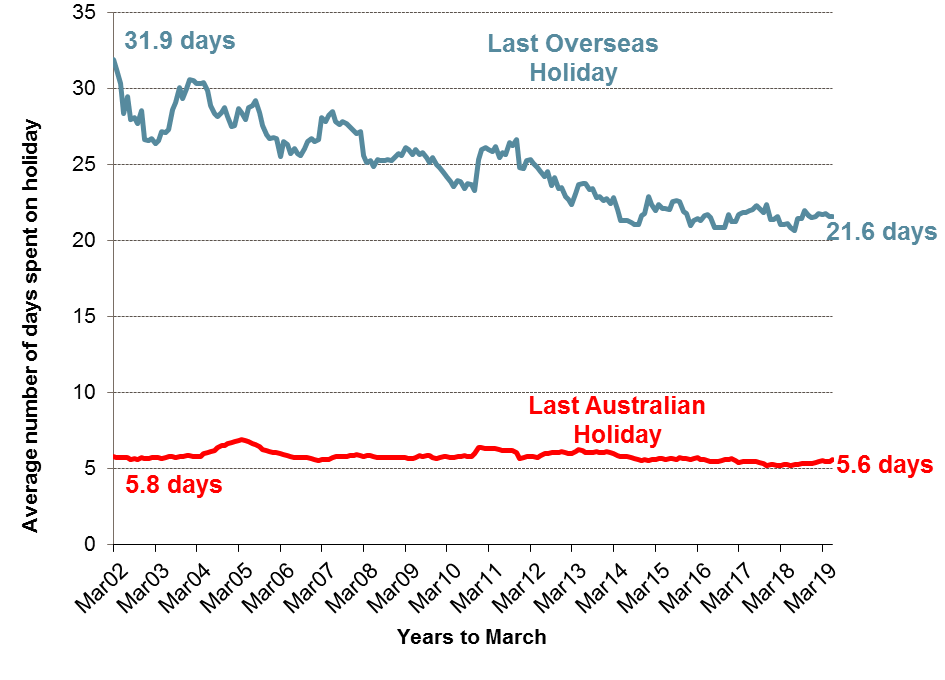
Source: Roy Morgan Single Source (Australia) April 2001 – March 2019. Base: Australians 14+.
Michele Levine, CEO, Roy Morgan, says:

“Even with 140 million days accrued of Annual Leave, Australians are taking shorter holidays when going overseas.
“When they do go overseas the locations that top the list are: New Zealand, England, United States, Bali and France.
“Looking at intention to travel overseas the places that we would like to go are: New Zealand, United States, England, Japan and Canada.
“Shorter overseas holidays present Australian tourism with the opportunity to increase their share of the market.
“To find out more go to the Holiday Currency Report or simply ask Roy Morgan.”
For comments or more information please contact:
Roy Morgan - Enquiries
Office: +61 (03) 9224 5309
askroymorgan@roymorgan.com
Margin of Error
The margin of error to be allowed for in any estimate depends mainly on the number of interviews on which it is based. Margin of error gives indications of the likely range within which estimates would be 95% likely to fall, expressed as the number of percentage points above or below the actual estimate. Allowance for design effects (such as stratification and weighting) should be made as appropriate.
| Sample Size | Percentage Estimate |
| 40% – 60% | 25% or 75% | 10% or 90% | 5% or 95% | |
| 1,000 | ±3.0 | ±2.7 | ±1.9 | ±1.3 |
| 5,000 | ±1.4 | ±1.2 | ±0.8 | ±0.6 |
| 7,500 | ±1.1 | ±1.0 | ±0.7 | ±0.5 |
| 10,000 | ±1.0 | ±0.9 | ±0.6 | ±0.4 |
| 20,000 | ±0.7 | ±0.6 | ±0.4 | ±0.3 |
| 50,000 | ±0.4 | ±0.4 | ±0.3 | ±0.2 |