ANZ-Roy Morgan Consumer Confidence up 2.3pts to 78.1 as Consumer Confidence hits a record six months below 80
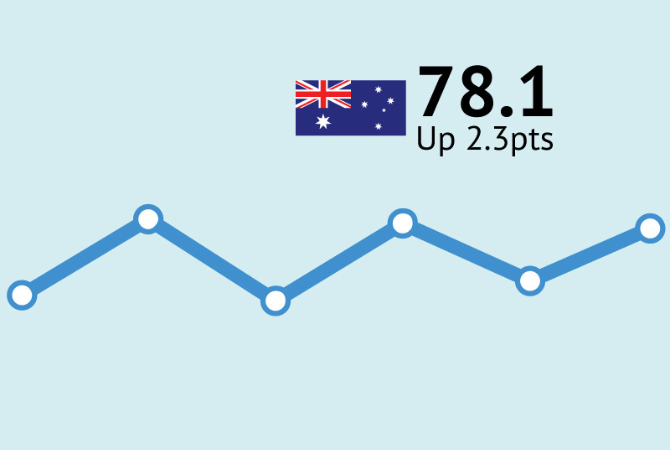
ANZ-Roy Morgan Consumer Confidence was up 2.3pts to 78.1 this week but despite the increase the index has now spent a record 26 straight weeks (equivalent to six months) below the mark of 80. Consumer Confidence is now 6.9pts below the same week a year ago, August 22-28, 2022 (85.0) and is in line with the 2023 weekly average of 78.1.
The small increase in Consumer Confidence continues a trend over the last month with the index oscillating in a narrow band of 3.5pts between 75-78.5. The index has now spent six straight weeks in this band averaging 76.8 since mid-July.
Looking around the States, Consumer Confidence was up in the three largest States of New South Wales, Victoria and Queensland, but down slightly in both Western Australia and South Australia.
Driving the improvement in the index this week were positive moves in sentiment related to both personal finances and the fortunes of the Australian economy over the next year.
Current financial conditions
Now under a fifth of Australians, 19% (unchanged) say their families are ‘better off’ financially than this time last year compared to a majority of 52% (down 1ppt) that say their families are ‘worse off’ financially.
Future financial conditions
Looking forward, under a third of Australians, 32% (up 3ppts), expect their family to be ‘better off’ financially this time next year while 34% (down 2ppts), expect to be ‘worse off’.
Current economic conditions
Only 7% (unchanged) of Australians expect ‘good times’ for the Australian economy over the next twelve months compared to over one-third, 36% (down 3ppts), that expect ‘bad times’.
Future economic conditions
Sentiment regarding the Australian economy in the longer term is relatively unchanged this week with only 11% (up 1ppt) of Australians expect ‘good times’ for the economy over the next five years compared to just over a fifth, 22% (up 1ppt), expecting ‘bad times’.
Time to buy a major household item
Sentiment regarding to buying intentions has improved this week with 21% (up 3ppts) of Australians, who now say it is a ‘good time to buy’ major household items while a clear majority of 55% (unchanged), say now is a ‘bad time to buy’.
ANZ Senior Economist, Adelaide Timbrell, commented:

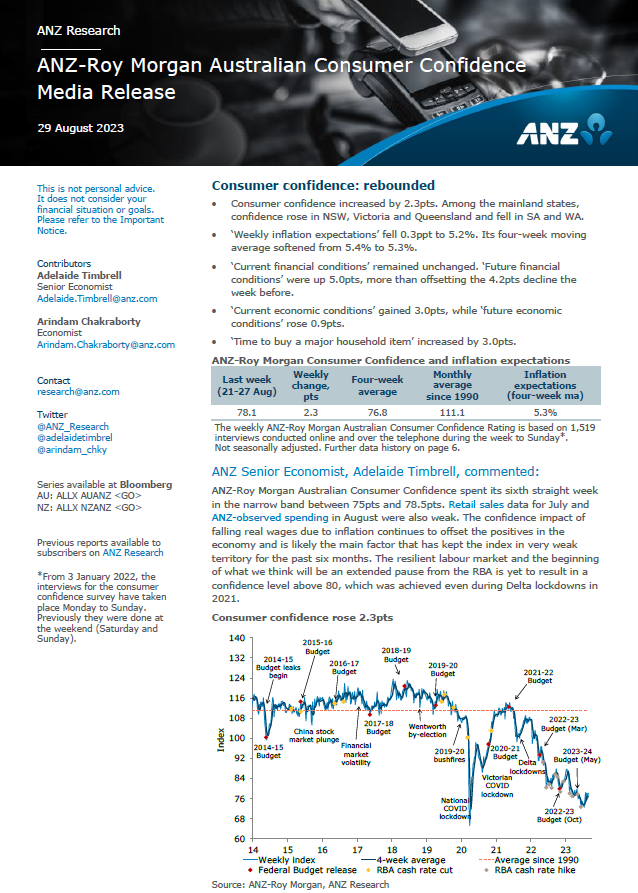
ANZ-Roy Morgan Australian Consumer Confidence spent its sixth straight week in the narrow band between 75pts and 78.5pts. Retail sales data for July and ANZ-observed spending in August were also weak. The confidence impact of falling real wages due to inflation continues to offset the positives in the economy and is likely the main factor that has kept the index in very weak territory for the past six months. The resilient labour market and the beginning of what we think will be an extended pause from the RBA is yet to result in a confidence level above 80, which was achieved even during Delta lockdowns in 2021.
Check out the latest results for our weekly surveys on Business Confidence, Consumer Confidence, and Voting Intention as follows:
Roy Morgan Business Confidence Statistics
ANZ – Roy Morgan Consumer Confidence Statistics
Federal Voting – Government Confidence Rating
Related Research Reports
The latest Roy Morgan Consumer Confidence Monthly Report is available on the Roy Morgan Online Store. It provides demographic breakdowns for Age, Sex, State, Region (Capital Cities/ Country), Generations, Lifecycle, Socio-Economic Scale, Work Status, Occupation, Home Ownership, Voting Intention, Roy Morgan Value Segments and more
Consumer Confidence – Monthly Detailed Report in Australia.
Business Confidence – Monthly Detailed Report in Australia.
Consumer Banking Satisfaction - Monthly Report in Australia.
For comments or more information please contact:
Roy Morgan - Enquiries
Office: +61 (03) 9224 5309
askroymorgan@roymorgan.com
Margin of Error
The margin of error to be allowed for in any estimate depends mainly on the number of interviews on which it is based. Margin of error gives indications of the likely range within which estimates would be 95% likely to fall, expressed as the number of percentage points above or below the actual estimate. Allowance for design effects (such as stratification and weighting) should be made as appropriate.
| Sample Size | Percentage Estimate |
| 40% – 60% | 25% or 75% | 10% or 90% | 5% or 95% | |
| 1,000 | ±3.0 | ±2.7 | ±1.9 | ±1.3 |
| 5,000 | ±1.4 | ±1.2 | ±0.8 | ±0.6 |
| 7,500 | ±1.1 | ±1.0 | ±0.7 | ±0.5 |
| 10,000 | ±1.0 | ±0.9 | ±0.6 | ±0.4 |
| 20,000 | ±0.7 | ±0.6 | ±0.4 | ±0.3 |
| 50,000 | ±0.4 | ±0.4 | ±0.3 | ±0.2 |


