More than 6.7 million Australians ‘work from home’

New research from Roy Morgan reveals that over 6.7 million Australians, representing 46% of employed Australians, work from home at least some of the time paid or unpaid. The remaining 54% work entirely in-person.
A slim majority of full-time employees (51%) ‘work from home’ at least some of the time compared to just over a third of part-time employees (36%).
A majority of workers in Sydney, Melbourne and Canberra ‘work from home’
Australians living in capital cities are more likely to ‘work from home’ than those who live in regional areas. A majority of workers from Australia’s largest cities of Sydney (55%) and Melbourne (52%) ‘work from home’, as do a bare majority of 51% in the nation’s capital in Canberra/ACT.
‘Working from home’ rates are lower in the smaller capital cities led by Hobart (45%) and Adelaide (44%) and followed by Brisbane (43%) and Perth (40%).
In contrast, regional areas show lower adoption of working from home, 40% in regional Queensland, 39% in Regional NSW, 37% in regional Victoria, 36% in regional Tasmania, 34% in Darwin/Alice Springs (NT), 33% in regional South Australia, and 31% in regional Western Australia report working from home.
% of Australian workers who ‘Work from Home’ & ‘No Work From Home’ by Capital Cities
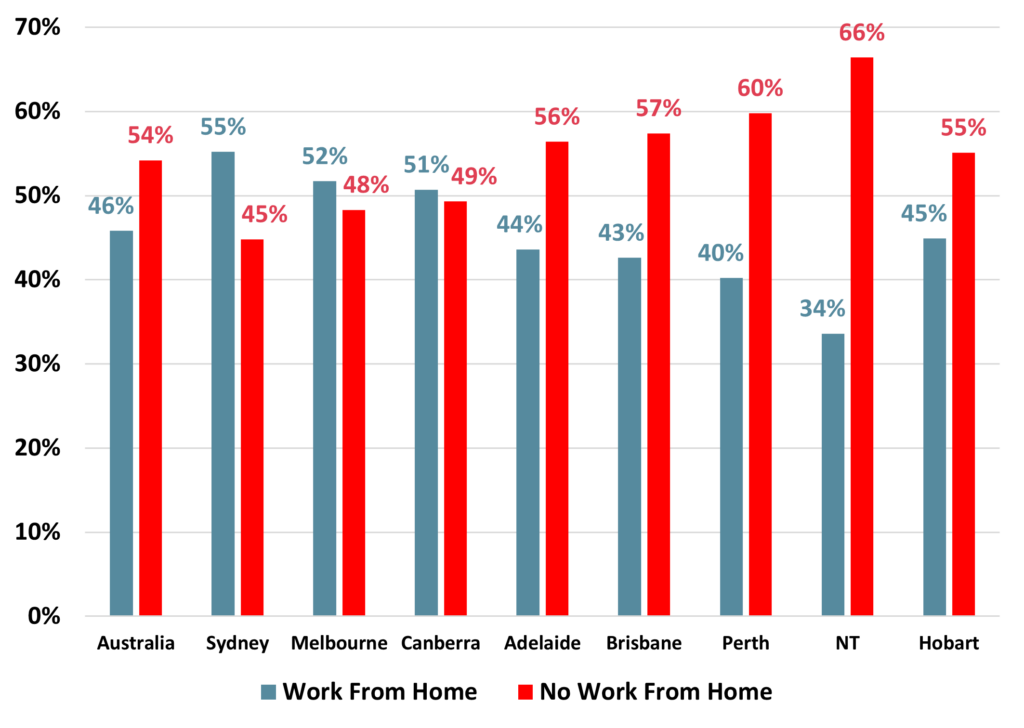
Source: Roy Morgan Single Source: Base: Employed Australians aged 14+ July 2024 to June 2025 (n=41,449).
Most (70%) of Sydney’s CBD workers are ‘working from home’ at least some of the time
Across Australia’s major ‘Central Business Districts’ (CBDs)*, a clear majority of 60% of people who work in the CBDs ‘work from home’ at least some of the time compared to 40% that don’t.
Sydney CBD leads the nation with nearly 70% of those working in the CBD ‘working from home’ at least some of the time compared to just 30% that don’t ‘work from home’ just ahead of Melbourne CBD which records 65% of those working in the CBD ‘working from home’ compared to only 35% that don’t.
In our nation’s capital a majority of 61% of employees working in the Canberra CBD ‘work from home’ compared to 39% that don’t, while Brisbane CBD has 52% ‘working from home’ and 48% that don’t. Among Hobart CBD a slim majority of 51% of employees ‘work from home’ and 49% don’t.
Only three Australian capitals record a minority of their CBD workforce ‘working from home’: Perth CBD (49%), Adelaide CBD (45%) and Darwin CBD (42%).
City Workers by ‘Work From Home’ for Capital City CBDs
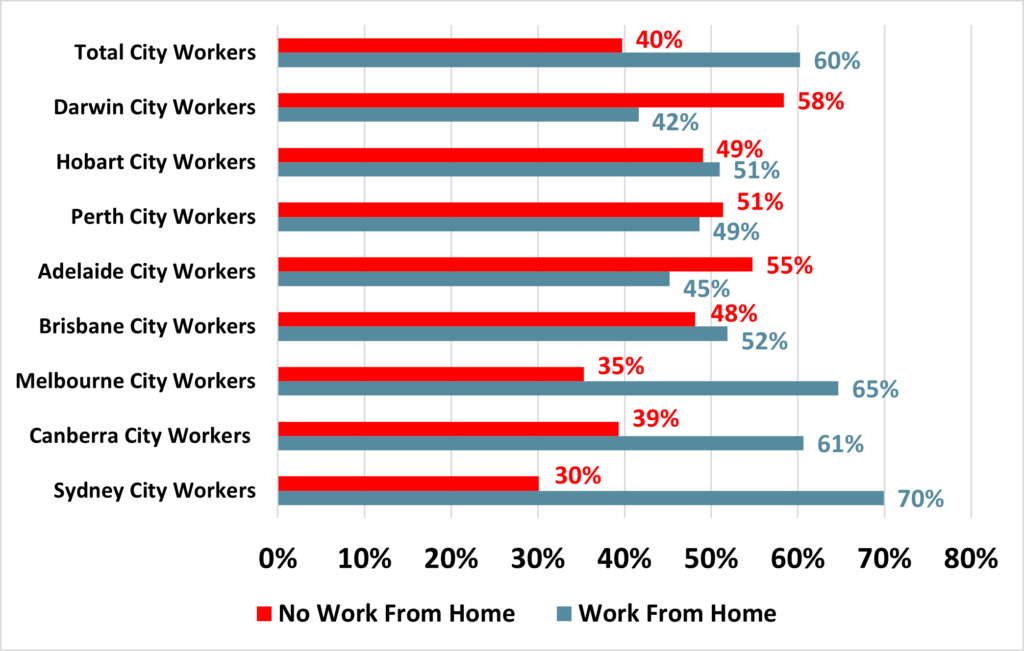
Source: Roy Morgan Single Source: Base: Employed Australians aged 14+ July 2024 to June 2025 (n=41,449). *CBD workers are defined as those employed within the core postcode areas of each capital city: Sydney (2000), Melbourne (3000), Brisbane (4000), Adelaide (5000), Perth (6000), Hobart (7000), Darwin (0800), and Canberra (2601).
Workplace Size is a key factor in determining rates of ‘working from home’
There is a strong correlation between ‘working from home’ and workplace size.
Solo workers, or the self-employed, lead the way with the highest ‘working from home’ rate at 55%, underscoring the autonomy and adaptability that comes with independent work.
Small workplaces with 2 to 4 employees also show a relatively high ‘work-from-home’ rate of 48%, but this figure drops 10% points to 38% for workplaces with both 5 to 9 employees and 10 to 24 employees, likely reflecting the more hands-on, client-facing, or operational nature of roles in these smaller businesses.
As organisations grow in workforce size, flexible working arrangements increase incrementally. Workplaces with 25 to 49 employees have 42% ‘working from home’, those with 50 to 99 employees have 44% ‘working from home’, and those with 100 to 299 employees have 45% ‘working from home’.
Notably, once workplaces reach 300+ employees the ‘work from home’ rate is at, or near, a majority of the workforce. For workplaces with 300 to 499 employees, the ‘work-from-home’ rate is 49%, increasing to 51% for workplaces of 500 to 999 employees and 52% for large workplaces with 1,000 or more employees.
This pattern highlights a tipping point where larger organisations possess the resources and culture necessary to support ‘working from home’ on a broader scale. The data also indicates that while the smallest workplaces (solo workers) enjoy the greatest individual flexibility, it is the largest workplaces that lead majority working from work adoption, demonstrating that workplace size drives working from home in fundamentally different ways.
Workplace Size by Work From Home & No Work From Home
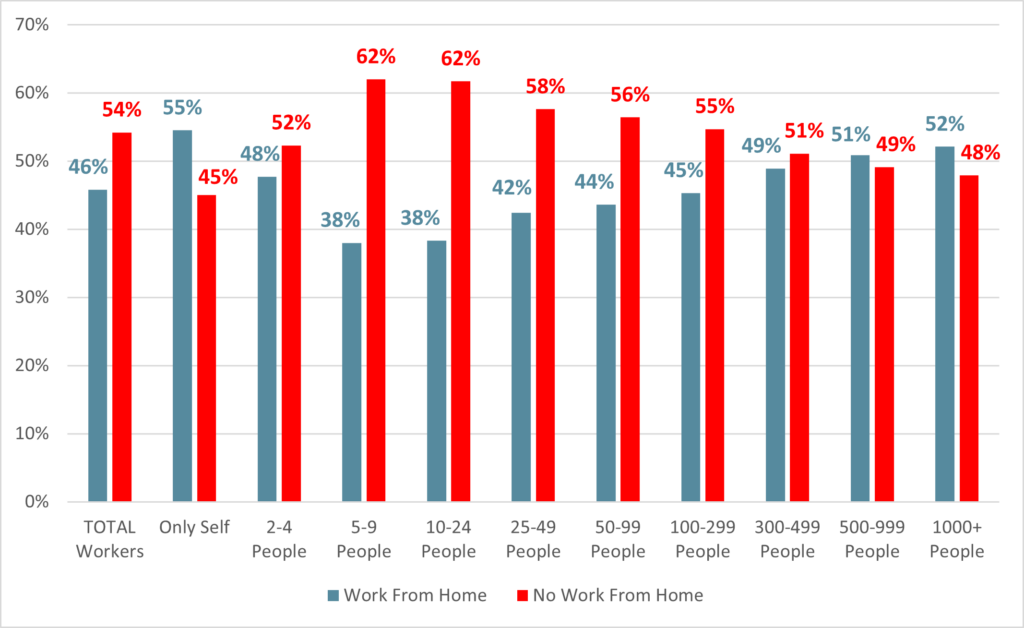
Source: Roy Morgan Single Source: Base: Employed, Aged 14+ July 2024 to June 2025 (n 41,449).
Work From Home Rates Vary Significantly Across Industries and Employment Sectors
Roy Morgan’s research highlights substantial differences in ‘work-from-home’ rates across industries and employment sectors, reflecting the varied nature of jobs and workplace flexibility across Australia.
Finance & Insurance leads with 66% of workers ‘working from home’ at least some of the time, while 34% work entirely in-person, followed by Communication (61%), Property & Business Services (57%), and Public Administration & Defence (56%).
Sectors such as Retail, Recreation & Personal Services, and Transport & Storage see much lower ‘work-from-home’ adoption. Retail has just 31% ‘working from home’ while 69% are entirely in-person, Recreation & Personal Services record 37% ‘working from home’ and 63% in-person, and Transport & Storage have 38% ‘working from home’ versus 62% in-person.
‘Work-from-home’ rates also differ by employment type. Self-employed Australians lead with 54% ‘working from home’ and 46% in-person. Public service employees have 47% ‘working from home’ and 53% in-person, while private industry workers record only 44% ‘working from home’ and 56% entirely in-person.
Higher Earnings Linked to Greater ‘Work-from-Home’ Flexibility
The data shows a clear link between income and the likelihood of ‘working from home’. At the lowest income levels, under $6,000, just 25% of employees ‘work from home’, with 75% entirely in-person. Rates remain low across other very low-income groups, with only 22–30% working from home up to the $24,999 bracket.
From the $25,000 mark upward, participation begins to climb. WFH rates move from 33–36% in the $30,000–$49,999 range to 38% for those earning $50,000–$59,999 and 42% for $60,000–$69,999.
The increase accelerates above $70,000: 45% at $70k–$79k and 46% at $80k–$89k. A notable shift occurs once earnings exceed $90,000, with more than half (53%) ‘working from home’. Rates continue rising steadily, reaching 56–58% between $100,000 and $149,999, and 61% for $150,000–$199,999.
At the highest levels, ‘work from home’ peaks at 64% for those earning $300,000 or more, with only 36% working entirely in-person.
This trend reflects the nature of different roles: lower-income jobs often require physical presence, while higher-income positions are more likely to involve desk-based, or technology-enabled work that can be performed remotely.
Overall, the findings highlight income as a strong driver of flexible work access, with remote work heavily concentrated in higher salary brackets.
Personal income by Working from Home
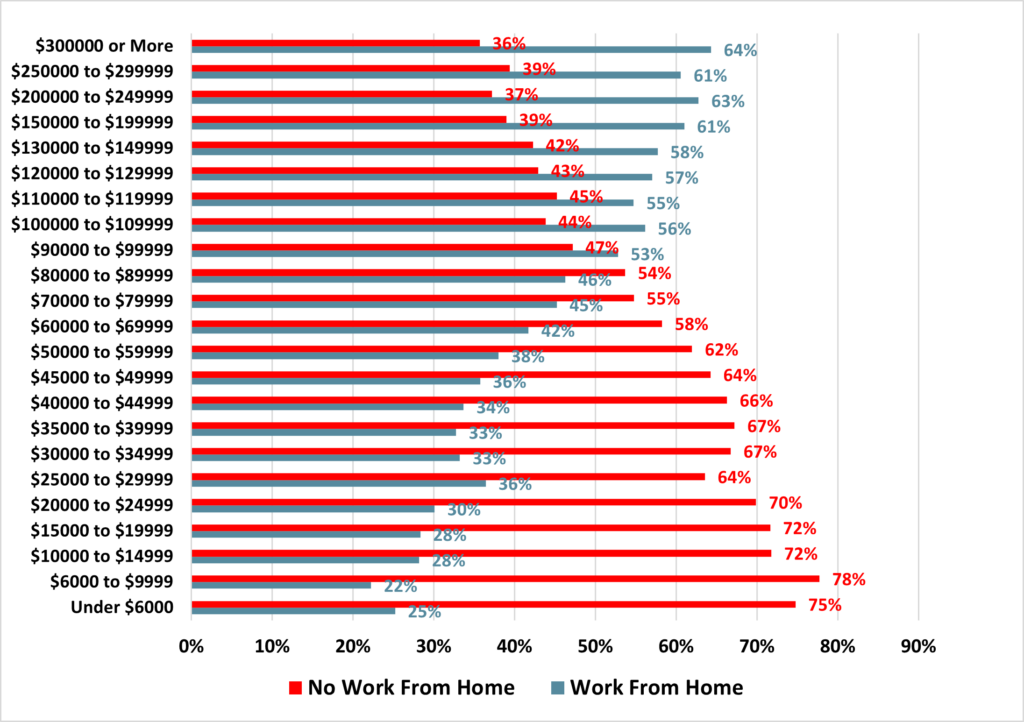
Source: Roy Morgan Single Source: Base: Employed, Aged 14+ July 2024 to June 2025 (n 41,449).
Roy Morgan CEO Michele Levine says:

“These latest Roy Morgan findings clearly show that ‘work-from-home’ arrangements have become a permanent and distinct feature of Australia’s employment sector. Nearly half of all employed Australians (46%, representing over 6.7 million people) now ‘work from home’ at least some of the time, with uptake strongest in the capital cities and industries suited to flexible roles like Finance, Communication, and Public Administration.
“Across Australia’s largest cities, 60% of people who work in the CBDs ‘work from home’ at least some of the time, with Sydney CBD leading at nearly 70% of workers. Melbourne CBD and Canberra CBD follow closely with majorities of 65% and 61% respectively.
“A majority of employees in the Brisbane CBD (52%) and Hobart CBD (51%) also ‘work from home’ at least some of the time. However, there are three capital cities for which a majority of their CBD workforce does not ‘work from home’ – Perth (51%), Adelaide (55%), and Darwin (58%).
“The data reveals significant variation by workplace size, sector, and income level, with higher earners more likely to have access to ‘working from home’ compared to lower-income employees.
“The issue of ‘working from home’ has been front and centre in recent weeks after Victorian Premier Jacinta Allan announced her government would enshrine a legal right for employees to ‘work from home’ at least two days a week where the nature of the job means this is a reasonable proposition under proposed Australian-first legislation.
“Looking forward, next week Treasurer Jim Chalmers is convening a National Economic Forum Roundtable to discuss ways ‘to improve productivity, enhance economic resilience and strengthen budget sustainability’ in the Australian economy.
“To pursue these goals the Economic Roundtable will bring together a select list of leaders from business, unions, civil society, government and other experts’ – and clearly the benefits and drawbacks of ‘working from home’ will be a key factor within these discussions.
“Gaining an in-depth understanding of the nuances surrounding current ‘working from home’ trends across different cities, industries, workplace sizes and income bands is vital to understand as businesses, employees, and policymakers adapt to a rapidly changing workforce landscape.”
Roy Morgan interviewed a representative sample of 41,449 employed Australians between July 2024 and June 2025. The definition for ‘Working From Home’ includes Employed/ Self-Employed people who work from home either paid or unpaid.
Roy Morgan’s ‘Work From Home’ research can be further analysed by employment type (paid, unpaid, self-employed), ANZSCO occupation, workplace location, media consumption, demographics, and more.
For comments or more information about Roy Morgan’s data please contact Andrew Calvert-Jones or Julian McCrann for more details.
Reports available for sale:
The latest Roy Morgan data is available on the Roy Morgan Online Store. It provides demographic breakdowns for Age, Sex, State, Region (Capital Cities/ Country), Generations, Lifecycle, Socio-Economic Scale, Work Status, Occupation, Home Ownership, Voting Intention, Roy Morgan Value Segments, Helix Personas, Media Consumption, and more
Related Research:
About Roy Morgan
Roy Morgan is Australia’s largest independent Australian research company, with offices in each state, as well as in the U.S. and U.K. A full-service research organisation, Roy Morgan has over 80 years’ experience collecting objective, independent information on consumers.
Margin of Error
The margin of error to be allowed for in any estimate depends mainly on the number of interviews on which it is based. Margin of error gives indications of the likely range within which estimates would be 95% likely to fall, expressed as the number of percentage points above or below the actual estimate. Allowance for design effects (such as stratification and weighting) should be made as appropriate.
| Sample Size | Percentage Estimate |
| 40% – 60% | 25% or 75% | 10% or 90% | 5% or 95% | |
| 1,000 | ±3.0 | ±2.7 | ±1.9 | ±1.3 |
| 5,000 | ±1.4 | ±1.2 | ±0.8 | ±0.6 |
| 7,500 | ±1.1 | ±1.0 | ±0.7 | ±0.5 |
| 10,000 | ±1.0 | ±0.9 | ±0.6 | ±0.4 |
| 20,000 | ±0.7 | ±0.6 | ±0.4 | ±0.3 |
| 50,000 | ±0.4 | ±0.4 | ±0.3 | ±0.2 |