


Peri capita: Gens Y and Z dominate Nando’s, but most customers elsewhere are Gen X or older
Almost half of Nando’s customers are Gen Y, compared with only around 3 in 10 at McDonald’s. 1 in 4 people in Red Rooster are Baby Boomers or older and just over 1 in 10 are Gen Z. And despite its elder members nearing 50, Gen X remains overrepresented at KFC and Hungry Jacks.
The latest data from Roy Morgan Research shows some notable differences in the composition of patrons at these fast food restaurants: 69% of customers at Nando’s are either Gen Y or Gen Z—a considerably higher proportion than is found at Hungry Jacks (50%), KFC (47%), McDonald’s (46%) or Red Rooster (45%).
At 25% of the nation, Gen Y is over-represented at each of these fast food outlets—but almost doubly so at Nando’s. Red Rooster is more Gen Y heavy than both KFC and McDonalds, but their successors Gen Z are less likely to be found inside one than out.
Proportion of customers (last 4 weeks) by Generation
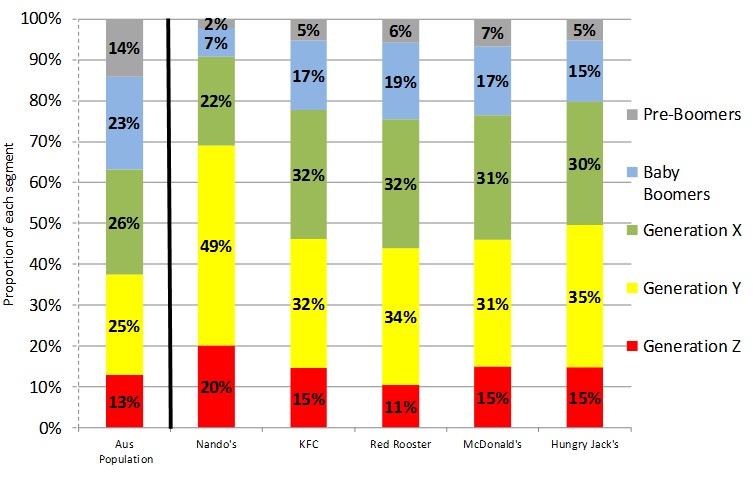
Source: Roy Morgan Single Source (Australia), Oct 2012 – Sep 2013, sample n = 19,585
Warren Reid, Group Account Manager, Roy Morgan Research, says:

“Nando’s is clearly distinguished by its skew toward Generations Y and Z, with a 19% point lead over nearest competitor Hungry Jacks in the proportion of its customer base from these groups.
“Nando’s risqué marketing campaigns clearly resonate with young Australians, and they support this with cleverly positioned stores in metro areas and around campuses to best serve this target market.
“Securing loyalty among younger people is a potentially winning strategy, and Nando’s will be aiming to maintain this customer base as they grow older and visit as a family rather than a group of friends.
“The value of long-term family loyalty is evident in the continued over-representation of Generation X in the fast food restaurants they grew up with.
“According to Roy Morgan’s new psychographic classification system Helix Personas, ‘Social Academics’ (209) in the Metrotech community are the most likely persona to visit Nando’s. This group comprises many young students, renting in the city with housemates, interested in socialising, technology and their health.”
For comments or more information please contact:
Warren Reid, Group Account Manager
Telephone: +61 (3) 9224 5161
Warren.Reid@roymorgan.com
Please click on this link to the Roy Morgan Online Store
Related Research
Click here to view our extensive range of Quick Service Restaurant Profiles, including Nando’s, McDonalds, KFC, Red Rooster and Hungry Jacks, or our range of Media Profiles including internet, social media, television, pay TV, radio and more. These profiles provide a broad understanding of the target audience, in terms of demographics, attitudes, activities and media usage in Australia.
About Roy Morgan Research
Roy Morgan Research is the largest independent Australian research company, with offices in each state of Australia, as well as in New Zealand, the United States and the United Kingdom. A full service research organisation specialising in omnibus and syndicated data, Roy Morgan Research has over 70 years’ experience in collecting objective, independent information on consumers.
In Australia, Roy Morgan Research is considered to be the authoritative source of information on financial behaviour, readership, voting intentions and consumer confidence. Roy Morgan Research is a specialist in recontact customised surveys which provide invaluable and effective qualitative and quantitative information regarding customers and target markets.
Margin of Error
The margin of error to be allowed for in any estimate depends mainly on the number of interviews on which it is based. Margin of error gives indications of the likely range within which estimates would be 95% likely to fall, expressed as the number of percentage points above or below the actual estimate. Allowance for design effects (such as stratification and weighting) should be made as appropriate.
| Sample Size | Percentage Estimate |
| 40% – 60% | 25% or 75% | 10% or 90% | 5% or 95% | |
| 1,000 | ±3.0 | ±2.7 | ±1.9 | ±1.3 |
| 5,000 | ±1.4 | ±1.2 | ±0.8 | ±0.6 |
| 7,500 | ±1.1 | ±1.0 | ±0.7 | ±0.5 |
| 10,000 | ±1.0 | ±0.9 | ±0.6 | ±0.4 |
| 20,000 | ±0.7 | ±0.6 | ±0.4 | ±0.3 |
| 50,000 | ±0.4 | ±0.4 | ±0.3 | ±0.2 |

