Overall Australian unemployment and under-employment at over 3.2 million in May; ‘Real Unemployment’ at 1.7 million
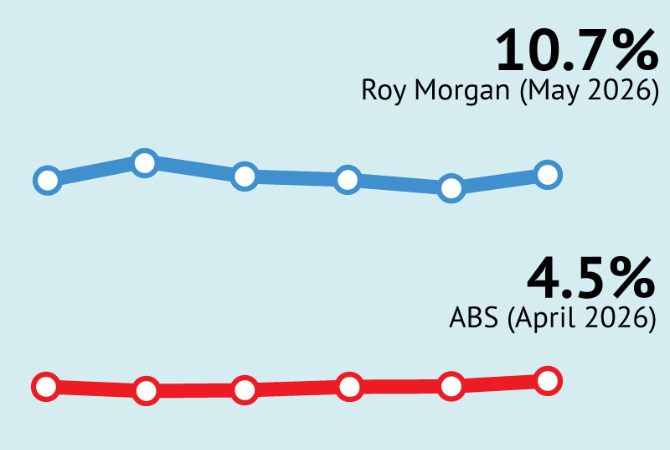
In May 2026, Australian ‘real’ unemployment increased 69,000 to 1,704,000 (10.7% of the workforce, up 0.6%), and under-employment dropped 136,000 to 1,503,000 (down 0.7% to 9.5%).
Roy Morgan estimates the overall workforce size (which adds together the employed and unemployed) at just under 15.9 million in May – 15,860,000 to be exact, down 231,000 on a month ago, a third straight monthly decline, and representing 67.7% of Australians aged 14+.
The decrease in the workforce was driven by a drop in employment, down 300,000 to 14,156,000 - a third straight monthly decline in employment since February. There were declines in both full-time employment, down 224,000 to 8,921,000, and part-time employment, down 76,000 to 5,235,000. Overall employment represents 60.4% of Australians aged 14+.
Detailed Roy Morgan Employment Estimates in May 2026:
- Australian workforce decreased by 231,000 in May to just under 15.9 million:
In May the Australian workforce decreased 231,000 to 15,860,000 driven by the drop in employment, which was down 300,000 to 14,156,000. In contrast, unemployment increased 69,000 to 1,704,000.
- Both full-time employment and part-time employment dropped in May:
Overall employment was down 300,000 to 14,156,000 in May. The fall was driven by falls in both full-time employment, down 224,000 to 8,921,000, and now equivalent to 63% of employed Australians, and part-time employment, down 76,000 to 5,235,000 and equivalent to 37% of employed Australians.
- Unemployment increased 0.6% to 10.7% in May driven by a rise in part-time unemployment:
1,704,000 Australians were unemployed (10.7% of the workforce, up 0.6%), up 69,000 from April. This increase was driven by more people looking for part-time work, up 143,000 to 1,104,000. However, there was a drop in people looking for full-time work, down 74,000 to 600,000.
- Under-employment dropped 0.7% to 9.5% in May, a third straight monthly decline:
In addition to the unemployed, a further 1.5 million Australians (9.5% of the workforce, down 0.7%) were under-employed, i.e. working part-time but looking for more work, down 136,000 from April. In total 3.21 million Australians (20.2% of the workforce) were either unemployed or under-employed in May.
- Comparisons with a year ago show that the population, workforce and employment have grown over the last year, but overall unemployment and under-employment is also up:
The Australian population aged 14+ in May 2026 was estimated at 23,441,000 (up 383,000 from May 2025). The workforce was 15,860,000 (up 120,000) – comprising 14,156,000 employed (up 131,000) and 1,704,000 unemployed (down 11,000). Unfortunately, under-employment is up 67,000 to 1,503,000 meaning overall unemployment and under-employment is up 56,000 to 3,207,000 from May 2025.
The May Roy Morgan Unemployment estimates were obtained by surveying an Australia-wide cross section of people aged 14+. A person is classified as unemployed if they are looking for work, no matter when. The ‘real’ unemployment rate is presented as a percentage of the workforce (employed & unemployed).
Roy Morgan Unemployment & Under-employment (2019-2026)
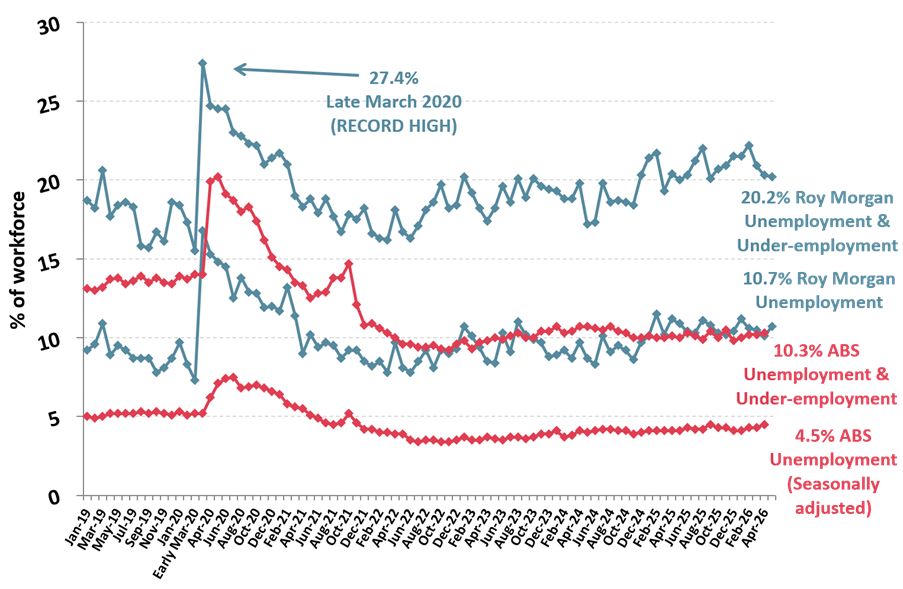
Source: Roy Morgan Single Source January 2019 – May 2026. Average monthly interviews 5,000.
Note: Roy Morgan unemployment estimates are actual data while the ABS estimates are seasonally adjusted.
Michele Levine, CEO Roy Morgan, says the latest Roy Morgan employment estimates for May show combined unemployment and under-employment continuing at a high level above 3 million for an 18th straight month:

“The latest Roy Morgan employment estimates for May show overall Australian unemployment and under-employment down 67,000 to 3,207,000 (20.2% of the workforce, down 0.1%). Despite the fall in overall unemployment and under-employment in May, labour under-utilisation is above 3 million Australians for an 18th straight month since late 2024.
“The fall in labour under-utilisation was due to a fall in under-employment, down 136,000 to 1,503,000 (9.5% of the workforce, down 0.7%). In contrast, unemployment increased by 69,000 to 1,704,000 (10.7% of the workforce, up 0.6%). However, this is the eighth straight month both unemployment and under-employment have been above 1.5 million.
“Although the fall in labour under-utilisation might seem like a positive development, there was a workforce contraction in May driven by a significant fall in employment, down 300,000 to 14,156,000. This is the third straight monthly decline in overall employment driven by falls in both full-time employment, down 224,000 to 8,921,000, and part-time employment, down 76,000 to 5,235,000.
“The Roy Morgan labour force estimates for May show a weak labour market with near record high part-time employment and falling full-time employment, which contains a large share of labour under-utilisation of over 20% – for an 18th straight month since late 2024.
“The latest official ABS GDP estimates for the March 2026 quarter show quarterly growth of only 0.3% and annual growth of just 2.5%. The low growth and weak state of the Australian labour markets show the Albanese Government has a lot of work to do to restore economic growth and the creation of new jobs for the over 3 million Australians unemployed or under-employed.”
This Roy Morgan survey on Australia’s unemployment and ‘under-employed’* is based on weekly interviews of 972,439 Australians aged 14 and over from January 2010 to May 2026 and includes 6,106 telephone and online interviews in April 2026. *The ‘under-employed’ are those people who are in part-time work or freelancers who are looking for more work.
To learn more about Roy Morgan’s mortgage data, call (+61) (3) 9224 5309 or email askroymorgan@roymorgan.com. Please click on this link to the Roy Morgan Online Store.
About Roy Morgan
Roy Morgan is Australia’s largest independent Australian research company, with offices in each state, as well as in the U.S. and U.K. A full-service research organisation, Roy Morgan has over 80 years’ experience collecting objective, independent information on consumers.
Margin of Error
The margin of error to be allowed for in any estimate depends mainly on the number of interviews on which it is based. Margin of error gives indications of the likely range within which estimates would be 95% likely to fall, expressed as the number of percentage points above or below the actual estimate. Allowance for design effects (such as stratification and weighting) should be made as appropriate.
| Sample Size | Percentage Estimate |
| 40% – 60% | 25% or 75% | 10% or 90% | 5% or 95% | |
| 1,000 | ±3.0 | ±2.7 | ±1.9 | ±1.3 |
| 5,000 | ±1.4 | ±1.2 | ±0.8 | ±0.6 |
| 7,500 | ±1.1 | ±1.0 | ±0.7 | ±0.5 |
| 10,000 | ±1.0 | ±0.9 | ±0.6 | ±0.4 |
| 20,000 | ±0.7 | ±0.6 | ±0.4 | ±0.3 |
| 50,000 | ±0.4 | ±0.4 | ±0.3 | ±0.2 |


