


More than 3.4 million Australians attend live theatre, ballet or opera led by people in Sydney and Melbourne
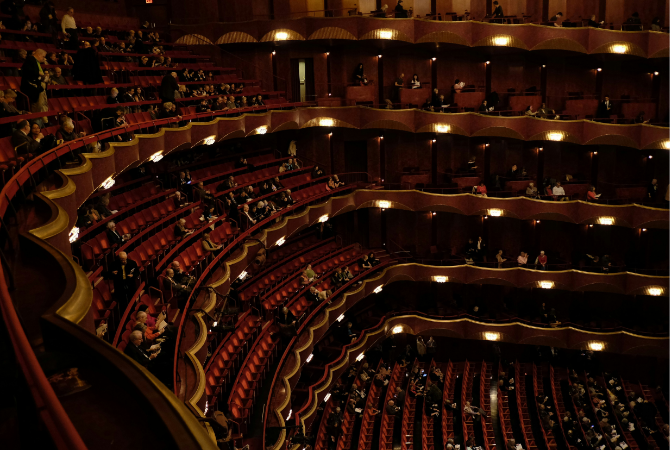
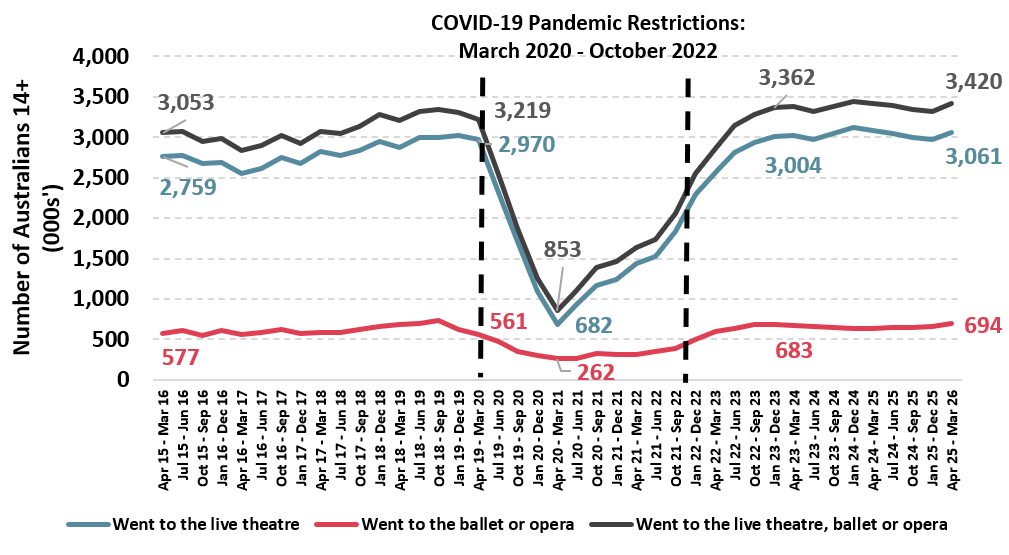
New data from Roy Morgan shows over 3.4 million Australians (14.7% of Australians aged 14+) attend live theatre, ballet or opera performances in an average three months. The latest data for the year to March 2026 is unchanged from a year earlier, but above pre-COVID levels from 2019-20.
Live theatre accounted for the large majority of the sector’s audience, with almost 3.1 million Australians (13.2%) attending in an average three months, unchanged from a year ago. Meanwhile, ballet and opera attendance reached 694,000 Australians, up 63,000 (+10%) from a year ago.
The longer-term trend shows the live performance market has largely recovered from its disruption caused by the COVID-19 pandemic (COVID-19 related restrictions were introduced in March 2020 and were fully lifted in October 2022 when mandatory isolation protocols ended) – at least in terms of overall attendance.
Prior to COVID-19 (12 months to March 2020), around 3.2 million Australians attended a live theatre, ballet or opera performance. This figure fell to around 853,000 in the year to March 2021 as lockdowns and venue closures in different States around Australia impacted attendance and availability.
Post pandemic audience numbers rebounded following the reopening of venues and numbers returned to pre-pandemic levels with overall attendance above 3.3 million by 2023. Over the past two years, numbers have remained relatively stable, with the latest figure showing 200,000 more Australians 14+ attending live theatre, ballet or opera compared to pre-COVID level in March 2020.
The rebound in numbers is partly due to the population increase seen since COVID-19. In fact, the percentage share of Australians attending live theatre, ballet or opera in the 12 months to March 2026 (14.7%) is down 0.7% points from the 12 months to March 2020 (15.4%).
Live theatre, ballet or opera attendance: 10-year trend (April 2015 – March 2026)
Source: Roy Morgan Single Source, April 2015 – March 2026. Base: Australians 14+. Average annual interviews, n=58,537.
Importantly, people who attend live theatre, ballet, and opera, are valuable audiences; 38% more likely than the average Australian to belong to the top AB socio-economic quintile[1], 29% more likely to work in a professional or managerial role, 17% higher median incomes than the average Australian, and holding 64% more in savings and investments.
Live theatre is an activity concentrated in capital cities; and dominated by Sydney and Melbourne
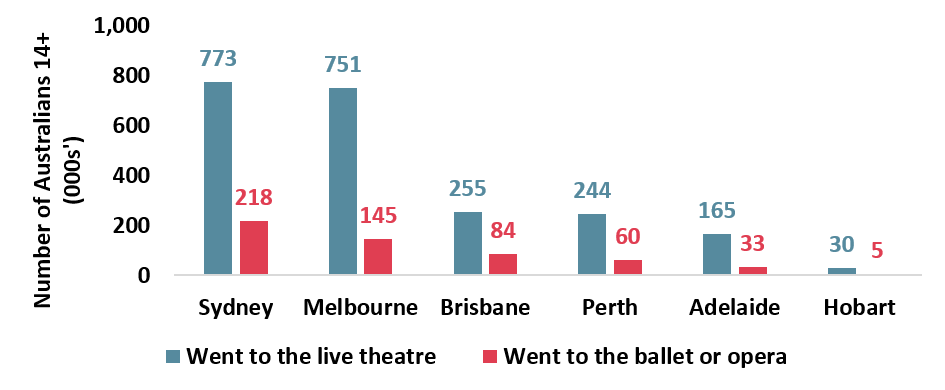
Nearly three-quarters (72.4%) of live theatre attendees reside in Australia’s capital cities, despite capital cities accounting for only 66% of Australia’s population. Melbourne and Sydney dominate live theatre attendance, attracting a combined audience of 1.52 million people, equivalent to around half of all theatre-goers nationally. Melbourne and Sydney residents are 23% more likely than the average Australian to attend live theatre.
Ballet and opera attendance is even more heavily concentrated in Australia's capital cities, which account for more than 78% of all attendees. Capital city participation increased by 11% year-on-year, driven largely by strong growth in Brisbane and Perth, and solid growth in Melbourne and Adelaide.
Live theatre, ballet or opera attendance by capital cities
Source: Roy Morgan Single Source, April 2025 – March 2026. Base: Australians 14+, n=59,706.
Sydney outpaces Melbourne in post-pandemic recovery
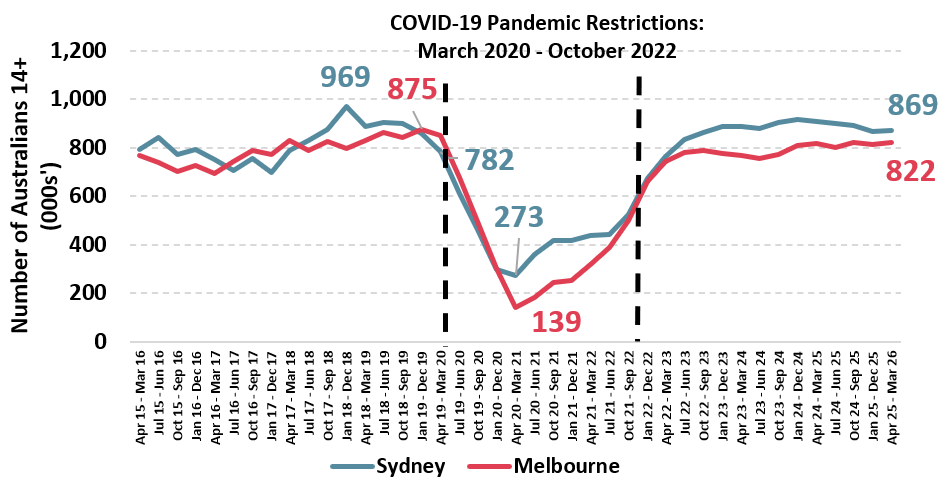
Between 2015 and 2019, audience numbers in both cities trended upward, Sydney typically maintained a slight lead and reached a higher peak, approaching one million attendees in the 12 months to December 2018. However, the gap between the two major cities was small before the COVID-19 pandemic with Melbourne ahead of Sydney during 2016-2018.
The decline during the pandemic was notably steeper in Melbourne, attendance fell to 139,000 during the most restrictive lockdown period, compared with approximately 273,000 in Sydney.
Since pandemic restrictions lifted in October 2022, both cities have experienced strong recoveries. However, Sydney’s recovery has been faster and more sustained, with overall live theatre, ballet and opera attendance above 800,000 since mid-2023.
In Melbourne, overall attendance for live theatre, ballet, and opera has also recovered strongly, and has now been above 800,000 since late 2024, but has generally remained below its pre-COVID peak in the 12 months to December 2019 (875,000).
In the latest period for the 12 months to March 2026, Sydney attracted 869,000 visitors to live theatre, ballet or opera compared to 822,000 people in Melbourne.
Melbourne vs Sydney: Live theatre, ballet or opera attendance over 10 years
Source: Roy Morgan Single Source, April 2015 – March 2026. Base: Australians 14+
Michele Levine, CEO Roy Morgan, says attendance at live theatre, ballet and opera has bounced back strongly after the pandemic lockdowns and restrictions from 2020-2022 although the share of Australians attending hasn’t returned to pre-pandemic highs in the late 2010s:

“The latest Roy Morgan data for the 12 months to March 2026 shows a quick rebound for attendance at Australia’s live theatre, ballet, and opera following the pandemic with over 3.4 million Australians (14.7% of the population) attending these live shows in an average three months.
“This compares to 3.2 million attendees (15.4%) immediately prior to the pandemic. Live theatre provides the lion share of this audience with over 3 million Australians (13.2%) now attending live theatre in an average three months compared to almost 700,000 (3%) attending the ballet or opera.
“Just prior to the COVID-19 pandemic, Melbourne, despite its smaller population, had more live theatre, ballet, and opera attendees than Sydney. However, the decline during the pandemic was notably steeper in Melbourne, attendance fell to 139,000 during the most restrictive lockdown period, compared with approximately 273,000 in Sydney.
“Since pandemic restrictions lifted in October 2022, both cities have experienced strong recoveries and today Sydney with 869,000 attendees is ahead of Melbourne with 822,000
“Sydney and Melbourne remain the key centres for live theatre, ballet, and opera, and around 1.52 million people in these two cities attend these cultural events – nearly half of the national audience.
“This is no surprise considering the wide array of theatres in the two cities. In Melbourne leading venues include the Regent Theatre, Princess Theatre, Her Majesty’s Theatre, Malthouse Theatre, Atheneum Theatre, and the extensive Arts Centre complex.
“Sydney’s venues are led by the world-renowned Sydney Opera House, Capitol Theatre, State Theatre, Lyric Theatre, Theatre Royal, and the Sydney Theatre Company in Walsh Bay.
[1] [1] Respondents are allocated scores for each of their income, education and occupation. The respondent’s scores for each of the three categories are then tallied to give a score out of 180. We then look at the frequency distribution of the scores and divide the population into five even groups of 20%, i.e. quintiles. The AB quintile is the highest level - people in this quintile have the highest scores.
For comments or more information about Roy Morgan’s activities data including attendance at live theatre, ballet, opera, and also sporting events and other cultural activities please contact:
Roy Morgan Enquiries
Office: +61 (3) 9224 5309
askroymorgan@roymorgan.com
About Roy Morgan
Roy Morgan is the source of the most comprehensive data on Australians’ behaviour and attitudes, surveying over 1,000 people weekly in a continuous cycle that has been running for two decades. The company has more than 80 years’ experience collecting objective, independent information.
Margin of Error
The margin of error to be allowed for in any estimate depends mainly on the number of interviews on which it is based. Margin of error gives indications of the likely range within which estimates would be 95% likely to fall, expressed as the number of percentage points above or below the actual estimate. Allowance for design effects (such as stratification and weighting) should be made as appropriate.
| Sample Size | Percentage Estimate |
| 40% – 60% | 25% or 75% | 10% or 90% | 5% or 95% | |
| 1,000 | ±3.0 | ±2.7 | ±1.9 | ±1.3 |
| 5,000 | ±1.4 | ±1.2 | ±0.8 | ±0.6 |
| 7,500 | ±1.1 | ±1.0 | ±0.7 | ±0.5 |
| 10,000 | ±1.0 | ±0.9 | ±0.6 | ±0.4 |
| 20,000 | ±0.7 | ±0.6 | ±0.4 | ±0.3 |
| 50,000 | ±0.4 | ±0.4 | ±0.3 | ±0.2 |


