


In October Australian ‘real unemployment’ up 0.7% to 11.3%, and under-employment increased 0.9% to 9.7%
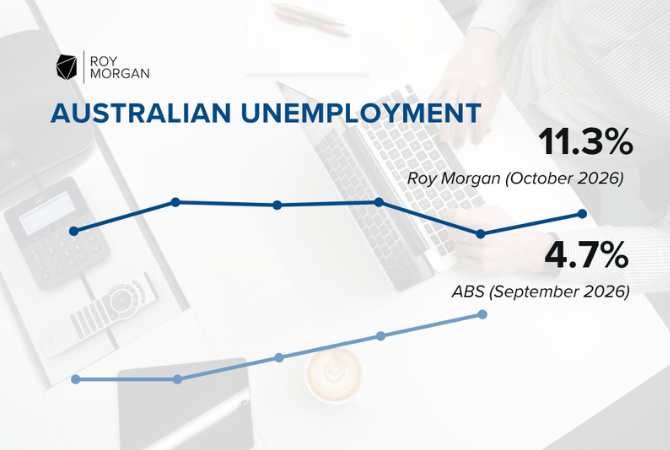
In October 2026, Roy Morgan estimates Australia’s ‘real unemployment’ increased 0.7% to 11.3% (up 117,000 to 1,784,000).
This was partly driven by a decrease in employment, down 22,000 to 13,983,000. This was due to a decrease in part-time employment, down 66,000 to 4,980,000, although full-time employment increased 44,000 to 9,003,000.
The overall result of these changes was an increase in the overall workforce size (which adds together the employed and unemployed) to just under 15.8 million – 15,767,000 to be exact, up 95,000 on a month ago, and representing 66.9% (up 0.3% from September) of Australians aged 14+.
Overall employment represents 59.3% (down 0.2% from September) of Australians aged 14+.
In addition to the increase in Australia’s ‘real unemployment’, up 117,000 to 1,784,000 (11.3% of the workforce, up 0.7%), under-employment increased 154,000 to 1,528,000 (up 0.9% to 9.7%).
Detailed Roy Morgan Employment Estimates in October 2026:
- The Australian workforce increased in October as people joined the workforce to look for work:
In October the Australian workforce increased 95,000 to 15,767,000 driven by an increase in people looking for work – ‘real unemployment’ increased 117,000 to 1,784,000. However, there was a decline in employment, which fell 22,000 to 13,983,000.
- Decrease in part-time employment drives overall employment decline in October:
Overall employment decreased 22,000 to 13,983,000 in October. The decrease was driven by a fall in part-time employment, down 66,000 to 4,980,000, and equivalent to 35.6% of employed Australians. In contrast, full-time employment increased 44,000 to 9,003,000, equivalent to 64.4% of employed Australians.
- Unemployment increased 0.7% to 11.3% in October:
In October, 1,784,000 Australians were unemployed (11.3% of the workforce, up 0.7%), up 117,000 from September. This increase was driven by more people looking for both full-time work, up 50,000 to 742,000, and part-time work, up 67,000 to 1,042,000.
- Under-employment increased 0.9% to 9.7% in October, up 154,000 to 1.53 million:
In addition to the unemployed, a further 1.53 million Australians (9.7% of the workforce, up 0.9%) were under-employed, i.e. working part-time but looking for more work, up 154,000. In total 3.31 million Australians (21.0% of the workforce, up 1.6%) were either unemployed or under-employed in October.
The October Roy Morgan Unemployment estimates were obtained by surveying an Australia-wide cross section of people aged 14+. A person is classified as unemployed if they are not employed and are looking for work, no matter when. The ‘real’ unemployment rate is presented as a percentage of the workforce (employed & unemployed).
Michele Levine, CEO Roy Morgan, says the latest Roy Morgan employment estimates for October shows rising unemployment and under-employment, and overall labour under-utilisation of over 3 million for a 23rd straight month:

“The latest Roy Morgan employment estimates for October show overall Australian unemployment and under-employment up 271,000 to 3,312,000 (21% of the workforce, up 1.6%).
“The increase in overall labour under-utilisation was driven by increasing unemployment – up 117,000 to 1,784,000 (11.3% of the workforce, up 0.7%) and rising under-employment – up 154,000 to 1,528,000 (9.7% of the workforce, up 0.9%).
“Unfortunately, overall employment was down in October, by 22,000 to 13,983,000. The fall in employment was driven by a decline in part-time employment, down 66,000 to 4,980,000. However, there was better news with full-time employment increasing 44,000 to 9,003,000.
“The Roy Morgan ‘real unemployment’ estimate of 11.3% is more than double the latest official ABS unemployment estimate of 4.7% for September 2026 – but aligns more closely with broader official estimates of unemployment. The ABS Potential Workers survey shows 1.7 million Australians are not working but wanting to work – the ‘potential workers’ – an almost identical figure to Roy Morgan’s monthly estimate of 1.78 million.
“The weakness in the Australian labour market hasn’t been helped by the elevated inflation which has led to the Reserve Bank increasing interest rates five times so far this year by a total of 1.25% to an 18-year high of 4.85% – including a recent interest rate increase of +0.25% in early November.
“The latest ABS Inflation estimates for the 12 months to September 2026 show inflation at 4.3%, still clearly above the Reserve Bank’s (RBA) target range of 2-3%. The continuing high inflation has led many to speculate that the RBA may well raise interest rates again before the end of the year.
“If the Reserve Bank decides to increase interest rates again in December this will add further pressure to an already weak labour market which has been struggling to grow during the last 12 months.”
This Roy Morgan survey on Australia’s unemployment and ‘under-employed’* is based on weekly interviews of 1,005,374 Australians aged 14 and over from January 2010 to October 2026 and includes 7,398 telephone and online interviews in October 2026. *The ‘under-employed’ are those people who are in part-time work or freelancers who are looking for more work.
To learn more about Roy Morgan’s mortgage data, call (+61) (3) 9224 5309 or email askroymorgan@roymorgan.com. Please click on this link to the Roy Morgan Online Store.
About Roy Morgan
Roy Morgan is Australia’s largest independent Australian research company, with offices in each state, as well as in the U.S. and U.K. A full-service research organisation, Roy Morgan has over 80 years’ experience collecting objective, independent information on consumers.
Margin of Error
The margin of error to be allowed for in any estimate depends mainly on the number of interviews on which it is based. Margin of error gives indications of the likely range within which estimates would be 95% likely to fall, expressed as the number of percentage points above or below the actual estimate. Allowance for design effects (such as stratification and weighting) should be made as appropriate.
| Sample Size | Percentage Estimate |
| 40% – 60% | 25% or 75% | 10% or 90% | 5% or 95% | |
| 1,000 | ±3.0 | ±2.7 | ±1.9 | ±1.3 |
| 5,000 | ±1.4 | ±1.2 | ±0.8 | ±0.6 |
| 7,500 | ±1.1 | ±1.0 | ±0.7 | ±0.5 |
| 10,000 | ±1.0 | ±0.9 | ±0.6 | ±0.4 |
| 20,000 | ±0.7 | ±0.6 | ±0.4 | ±0.3 |
| 50,000 | ±0.4 | ±0.4 | ±0.3 | ±0.2 |


