7.4 million Australians are now using Uber compared to around 4.2 million using taxis – a gap of over 3 million

The latest data from Roy Morgan shows over 7.4 million (32.3% of Australians aged 14+) used Uber, compared to around 4.2 million (18.1%) using taxis, during the March Quarter 2025 – a gap of over 3 million Australians for the first time in favour of Uber.
Usage of Uber has surged since the end of pandemic restrictions in the December Quarter 2022, increasing by 1.7 million (+29.8%). In comparison, usage of taxis has declined over the last two years, down by 212,000 (-4.8%) since the December Quarter 2022.
Even more striking is a comparison between usage of the two services today compared to pre-pandemic levels in the September Quarter 2019. Since late 2019 usage of Uber has increased by over 2.1 million (+40.6%) while usage of taxis has dropped by over 630,000 (-13.3%).
Uber’s popularity as a commercial passenger vehicle service in Australia overtook taxis during 2018-19 and quickly stretched its lead to over 1.5 million passengers by early 2021 amid the COVID-19 pandemic.
This new data comes from Roy Morgan Single Source, Australia’s most comprehensive consumer survey, derived from in-depth interviews with over 65,000 Australians each year.
Australians aged 14+ who used Uber and taxi services in an average three months (‘000)

Source: Roy Morgan Single Source, January 2016 – March 2025, quarterly average sample n = 14,692.
Base: Australians aged 14+.
Generation Z & Millennials biggest users of Uber, taxi use is more consistent across generations
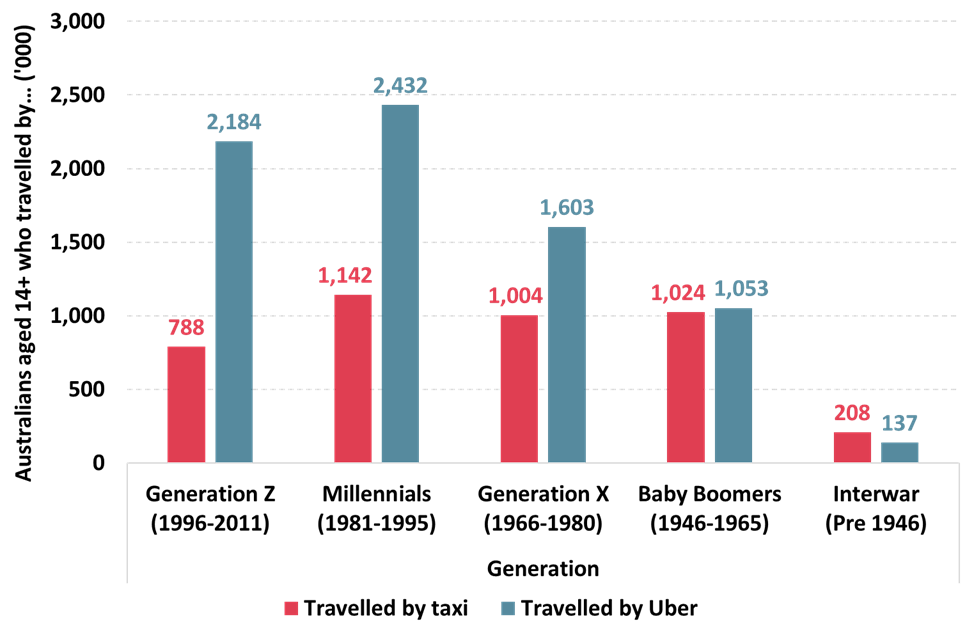
When we look at customers by generation, we can see that Uber dominates for Australians in the three youngest generations – Generation Z (born 1996-2011), Millennials (born 1981-1995) and Generation X (born 1966-1980) – effectively all Australians aged under 60.
The largest contrast is for Generation Z with 2.18 million (39.7% of this age group) using Uber in an average three-month period – almost three times as many as use taxis, 788,000 (14.3%).
Millennials are the biggest users of Uber with 2.43 million (40.5% of this age group) using Uber in an average three-month period, over twice as many as use taxis, 1,142,000 (19%). The two younger generations combined comprise over 4.6 million Uber users – equivalent to 62.3% of all Uber users.
Uber has a clear advantage among Generation X with over 1.6 million (33% of this age group) using Uber compared to around 1 million (20.7%) using taxis – a gap of around 600,000 in favour of Uber.
Baby Boomers are almost evenly split between people who use Uber, 1.05 million (19.1% of this age group), and those that use taxis, 1.02 million, (18.6%).
Only Australia’s oldest generation, the Interwar generation born before 1946 and now aged generally 80 years of age or older, still prefers using taxis to Uber. For the Interwar generation, 208,000 (19% of this age group), use taxis in an average three-month period compared to 137,000 (12.5%) who use Uber.
Australians who used Uber and taxi services in an average three months: By generation
Source: Roy Morgan Single Source, January – March 2025, n = 19,900.
Base: Australians aged 14+.
Michele Levine, CEO of Roy Morgan, says Uber is now clearly the dominant force in the commercial passenger vehicle market in Australia:

“The popularity of Uber has grown sharply in recent years – especially since the end of pandemic lockdowns in late 2021 and the lifting of all pandemic-era restrictions around a year later.
“Just before the pandemic struck usage of both Uber and taxi services reached pre-pandemic highs. In the September quarter 2019 Uber was used by 5.27 million Australians compared to 4.8 million Australians using taxis – a gap of less than 500,000 between the two services in favour of Uber.
“Although both services had steep passenger declines in 2020-21 due to pandemic restrictions – and especially extensive lockdowns in Australia’s two biggest markets of Sydney and Melbourne – Uber has rebounded quickly, while usage of taxis has not returned to pre-pandemic levels.
“Now over 7.4 million Australians use Uber, over 2.1 million higher than the pre-pandemic high of 5.27 million – an increase of 40.6%. This compares to a decline in usage of taxis by over 630,000 (-13.3%) over the same period to under 4.2 million using in the March quarter 2025.
“Digging into these figures shows that Uber is now the preferred commercial passenger vehicle service for Generation Z (2,184,000 cf. 788,000), Millennials (2,432,000 cf. 1,142,000), Generation X (1,603,000 cf. 1,004,000) and even Baby Boomers (1,053,000 cf. 1,024,000).
“Not only does Uber now have a far broader customer base than taxis, but Uber is used far more frequently by its customers. Uber’s 7.4 million users take an average of 1.35 trips by Uber in a three-month period compared to only 0.65 trips for the 4.16 million Australians using taxis.
“Interestingly, the most frequent users of both Uber and taxis are aged 25-34 (i.e., younger Millennials). However, Uber’s second most frequent users are aged 18-24 (Generation Z) whereas the second most frequent taxi customers are aged 50-64 and are mostly in Generation X.
“When we look at Uber users within specific locations, we see Perth having the highest Uber usage of any capital city, with 40.8% of residents having recently used one. This is closely followed by Sydney (40.1%), Canberra (37.1%), Adelaide (35.7%) and Melbourne (35.4%).”
For comments or more information about Roy Morgan’s transport data including for Uber, other ride-sharing services, taxi users and other consumer data please contact:
Roy Morgan Enquiries
Office: +61 (3) 9224 5309
askroymorgan@roymorgan.com
Margin of Error
The margin of error to be allowed for in any estimate depends mainly on the number of interviews on which it is based. Margin of error gives indications of the likely range within which estimates would be 95% likely to fall, expressed as the number of percentage points above or below the actual estimate. Allowance for design effects (such as stratification and weighting) should be made as appropriate.
| Sample Size | Percentage Estimate |
| 40% – 60% | 25% or 75% | 10% or 90% | 5% or 95% | |
| 1,000 | ±3.0 | ±2.7 | ±1.9 | ±1.3 |
| 5,000 | ±1.4 | ±1.2 | ±0.8 | ±0.6 |
| 7,500 | ±1.1 | ±1.0 | ±0.7 | ±0.5 |
| 10,000 | ±1.0 | ±0.9 | ±0.6 | ±0.4 |
| 20,000 | ±0.7 | ±0.6 | ±0.4 | ±0.3 |
| 50,000 | ±0.4 | ±0.4 | ±0.3 | ±0.2 |


