Net Promoter Scores® for electricity providers on the increase in 2025 after two years of decline
New data from Roy Morgan shows that improvements in the Net Promoter Scores® (NPS®) of electricity providers this year has correlated with a clear drop in switching behaviour.
After reaching a peak of -7 in the year to March 2022, the NPS® for electricity providers fell consistently over the next two years as surging electricity prices and cost of living concerns faced many Australians. The NPS® of electricity providers hit a low of -13 in the year to June 2024.
However, since the low point a year ago, NPS® have gradually turned around and have improved significantly so far this year – now at -8 in the latest figures to June 2025 indicating Australians are now increasingly more likely to recommend electricity providers to their friends than they were a year ago.
Of course, that negative sign (-8) means there are still more detractors than promoters in this market.
Net Promoter Scores® of Electricity Service Providers (2020 – 2025)
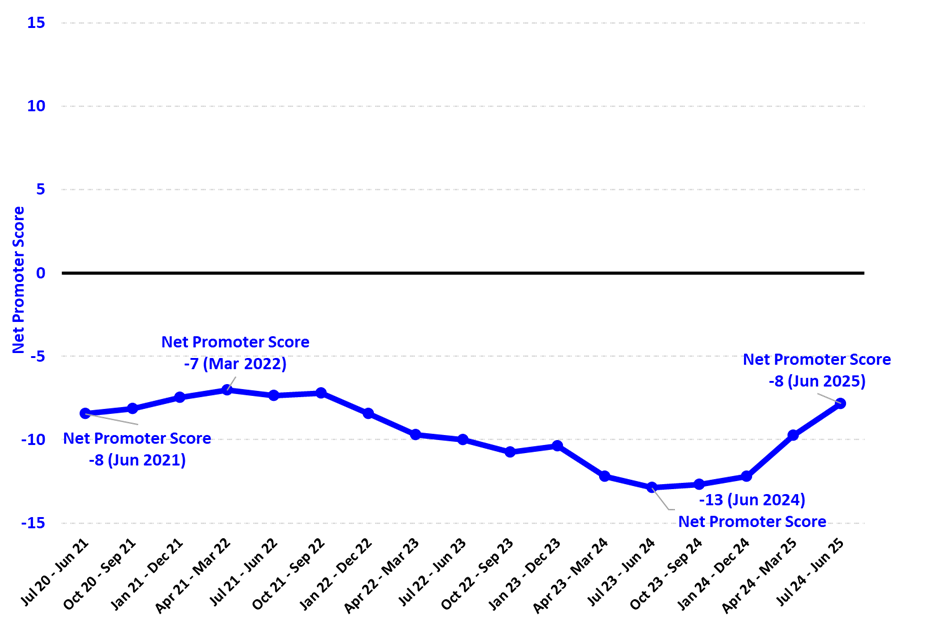
Source: Roy Morgan Single Source Australia: July 2020 – June 2021 to April 2024 – June 2025.
Base: Australians aged 14+, connected to electricity and NOT ‘Can’t Say’, average annual interviews, n=63,237.
Surging electricity prices have big impact on NPS® in ‘National Electricity Market’ (NEM) States
Australia’s residential electricity market saw a record-high increase in prices in 2022 and this factor was a major contributor to high inflation, rising interest rates and cost-of-living concerns for many Australians.
The National Electricity Market (NEM) Report from the Australian Competition & Consumer Commission (ACCC) published in December 2024, showed residential prices continuing to increase in 2022-23. Electricity prices increased by around 14% in the ‘NEM Region’ which includes the States of New South Wales, Victoria, Queensland, South Australia and Tasmania.
Influenced by these price hikes, NPS® of electricity providers declined markedly from 2022 to 2024 – especially across all States serviced by the NEM. However, during the first half of 2025 the NPS® in these States is finally starting to recover.
The NPS® for electricity providers in June 2025 in the NEM States includes Queensland now at -10 (down from -6 in 2022), New South Wales now at -9 (down from -8), Victoria now at -8 (down from -3), South Australia now at -6 (down from -3) and Tasmania now at -9 (down from -7).
In contrast, in Western Australia – which is outside the National Electricity Market (NEM), and for which the majority of the residential market is ‘non-contestable’ – the NPS® of electricity retailers had the shortest period of decline compared to their NEM counterparts – and has markedly improved over the last year.
The NPS® of WA electricity retailers is now at -2, a significant improvement from -15 back in early 2022.
Looking at the long-term picture, the chart below shows between 2022 and 2024 decreasing Net Promoter Scores® of electricity providers correlated closely with a sustained rise in switching behaviour.
Net Promoter Scores® of Electricity Service Providers & Switching Electricity Service Providers in the Last 12 Months (2020 – 2025)
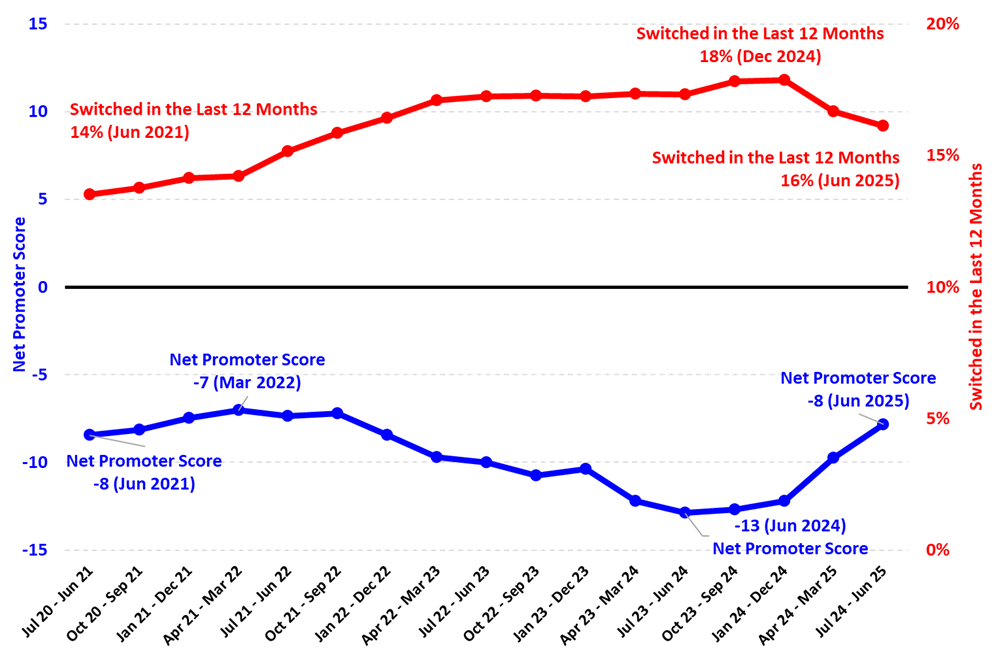
Source: Roy Morgan Single Source Australia: July 2020 – June 2021 to July 2024 – June 2025.
Base: Australians aged 14+, connected to electricity and NOT ‘Can’t Say’, average annual interviews, n=63,237.
Electricity customers are now more likely to switch providers – especially in NSW and Victoria
Almost one-in-six Australian electricity customers (16%) switched providers in the year to June 2025, down from a high of 18% in December 2024, but still higher than the 14% switching recorded during 2021 and early 2022. This rate of switching electricity providers (16%) represents around 1.63 million customer households.
The increases in switching behaviour began in different time periods during 2021 and 2022 depending on the State. The big States of New South Wales and Victoria are the primary drivers of the overall increase in switching. Almost one-in-five electricity customers in New South Wales (19%) switched providers in the last year, up 4% points since 2021, and 17% of Victorian electricity customers switched providers, up 4% points since 2021.
Switching providers has also increased in South Australia, up 3% points from 14% in early 2022 to 17% in early 2025 and in Queensland, up 2% points from 13% in late 2021 to 15% now.
Michele Levine, CEO, Roy Morgan, says the Net Promoter Scores ® of electricity providers are improving in 2025 after two years of decline from 2022-2024 due to surging electricity prices which led to an increase in Australians switching electricity providers:

“A close look at the behaviour of Australian electricity customers shows early signs of recovery in the Net Promoter Scores (NPS®) of electricity service providers in 2025 – now at -8 (12 months to June 2025) compared to an NPS® low of -13 a year ago.
“The improvement marks a change from two years of declines driven by the key States in the National Electricity Market (NEM) – New South Wales, Victoria, Queensland and South Australia.
“The cost-of-living crisis in recent years led to the highest inflation for over three decades and one of the key drivers was increasing energy prices – including electricity and other utility prices.
“The decline of NPS® is inversely correlated with electricity customers seeking new electricity providers. As NPS® for electricity service providers falls, electricity provider switching increases – and this is especially evident in the largest NEM States.
“Although switching electricity providers appears to have peaked in late 2024, it is still higher than three years ago (in 2021-22) in New South Wales (up 4% points to 19%), Victoria (up 4% points to 17%), South Australia (up 3% points to 17%) and Queensland (up 2% points to 15%).
“This Roy Morgan data clearly shows the direct impact that high, and rising energy prices have on consumer behaviour in the electricity market. As electricity prices rise, and Net Promoter Scores® decline, the switching behaviour of consumers increases.
“The latest figures show that despite a reduction in switching behaviour this year a huge market of 16% of Australian households, around 1.63 million, switched their electricity providers in the 12 months to June 2025.
“To find out the latest detailed data on the behaviour of customers in the electricity market – including the latest NPS® and switching behaviour of your customers, contact Roy Morgan now.”
To learn more about Roy Morgan’s Electricity NPS® and switching data for providers such as ActewAGL, AGL, Alinta, Aurora Energy, Covau, Dodo, EnergyAustralia, Ergon Energy, Horizon Power, Kogan Energy, Lumo Energy, Momentum Energy, Origin Energy, , Powershop, Powerwater Corporation, Red Energy, Engie, Sumo, Synergy, and more, call (+61) (3) 9224 5309 or email askroymorgan@roymorgan.com.
Please click on this link to the Roy Morgan Online Store to view additional in-depth reports and profiles on consumer data in the utility and energy industries.
Net Promoter Scores (NPS®)
Net Promoter Score and NPS® are registered trademarks of Bain & Company, Inc., Nice Systems, Inc. and Mr. Frederick Reichheld. Based on score of 9 or 10 minus 0 to 6 on an eleven-point scale, where one is not at all likely to recommend as an electricity provider and ten is extremely likely.
About Roy Morgan
Roy Morgan is the largest independent Australian research company, with offices in each state of Australia, as well as in the United States and the United Kingdom. A full-service research organisation specialising in omnibus and syndicated data, Roy Morgan has over 80 years’ experience in collecting objective, independent information on consumers.
Margin of Error
The margin of error to be allowed for in any estimate depends mainly on the number of interviews on which it is based. Margin of error gives indications of the likely range within which estimates would be 95% likely to fall, expressed as the number of percentage points above or below the actual estimate. Allowance for design effects (such as stratification and weighting) should be made as appropriate.
| Sample Size | Percentage Estimate |
| 40% – 60% | 25% or 75% | 10% or 90% | 5% or 95% | |
| 1,000 | ±3.0 | ±2.7 | ±1.9 | ±1.3 |
| 5,000 | ±1.4 | ±1.2 | ±0.8 | ±0.6 |
| 7,500 | ±1.1 | ±1.0 | ±0.7 | ±0.5 |
| 10,000 | ±1.0 | ±0.9 | ±0.6 | ±0.4 |
| 20,000 | ±0.7 | ±0.6 | ±0.4 | ±0.3 |
| 50,000 | ±0.4 | ±0.4 | ±0.3 | ±0.2 |


