Extreme mortgage stress eases nationally year-on-year, but surges in lowest socio-economic quintiles

Roy Morgan’s Single Source research reveals that while the share of owner-occupier mortgage holders ‘Extremely at Risk [1]’ of mortgage stress fell in the year to June 2025, the reduction is limited to the upper three socio-economic quintiles (60% of Australians). Lower-income households have not experienced the same relief (40% of Australians).
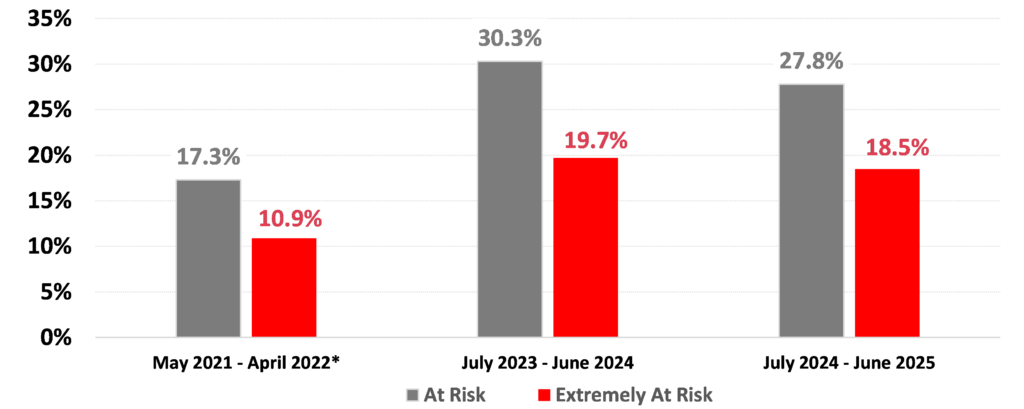
An estimated one million mortgage holders (18.5%) were ‘Extremely at Risk’ of mortgage stress in the 12 months to June 2025, down from 19.7% in June 2024. There was also a decline in the percentage of mortgage holders ‘At Risk [2]’ of mortgage stress (a less strict measure), from 30.3% in June 2024 to 27.8% in June 2025. This equates to 1.5 million mortgage holders.
Mortgage stress eased from 2024 driven by factors such as real wage growth as inflation declined, income tax cuts, home loan interest rate cuts and a rising share market.
Chart 1: Mortgage Stress among Owner Occupier Mortgage Holders
Source: Roy Morgan Single Source (Australia), average interviews per 12-month period, n=17,083
Base: Australians 14+ with owner occupied home loan. * Note: The Reserve Bank (RBA) lifted the cash rate in May 2022 to start the recent rising interest rate cycle, and from then mortgage stress began to increase. The RBA lifted interest rates from a record low of 0.1% in May 2022 to a cycle high of 4.35% in November 2023 – a series of 13 interest rate increases over an 18-month period by a total of 4.25%.
Mortgage stress only declined among the higher socio-economic groups
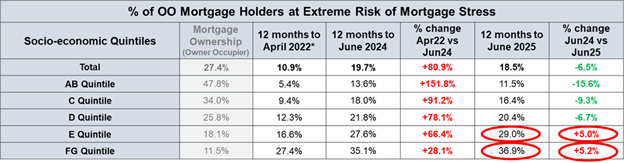
While the proportion of mortgage holders at ‘Extreme Risk’ of mortgage stress declined in the year to June 2025 (down 6.5%), the decline was only evident among those in the top three socio-economic quintiles [3].
Among those in the lowest two quintiles, the proportion of mortgage holders ‘at extreme risk’ of mortgage stress increased – by 5% among those in the E Quintile, and by 5.2% among those in the FG quintile.
Chart 2: ‘Extremely at Risk’ Mortgage Holders by Socio-Economic Quintiles
Source: Roy Morgan Single Source (Australia), average interviews per 12-month period, n=17,083
Base: Australians 14+ with owner occupied home loan. * Note: The RBA lifted the cash rate in May 2022 to start the recent rising interest rate cycle, and from when mortgage stress began to increase.
Slower income growth likely contributed to the increase in mortgage stress in the E and FG quintiles. While household income rose 7% in the year to June 2025 among mortgage holders overall, income rose substantially less among those in the E quintile (+1.5%) or FG quintile (+2.1%).
Declining employment looks to be a factor related to the slower income growth among the E and FG quintiles. While the proportion of mortgage holders in full-time employment was largely stable (+0.2%) in the year to June 2025, there was a fall in full-time employment among those in the E quintile (-1.3%) and FG quintile (-11.6%).
Mortgage stress has only declined among higher income earners
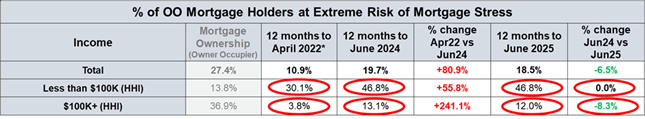
Mortgage holders with annual household incomes of under $100,000 are more likely to be ‘Extremely at Risk’ of mortgage stress. Only mortgage holders in households with annual incomes of $100,000 or more have seen a decline in mortgage stress.
Chart 3: Extremely at Risk’ Mortgage Holders by Household Income
Source: Roy Morgan Single Source (Australia), average interviews per 12-month period, n=17,083
Base: Australians 14+ with owner occupied home loan. * Note: The RBA lifted the cash rate in May 2022 to start the recent rising interest rate cycle, and from then mortgage stress began to increase.
Roy Morgan CEO, Michele Levine, commented:

“The proportion of mortgage holders classified as at ‘Extreme Risk’ of mortgage stress declined from 19.7% in June 2024 to 18.5% in June 2025. This improvement was underpinned by a combination of real wage growth, tax relief, falling home loan interest rates, and a stronger share market.
“However, the benefits of these positive economic trends have not been evenly distributed. The reduction in mortgage stress was concentrated among households in the top three socio-economic quintiles, representing 60% of Australians. In contrast, mortgage stress increased among those in the bottom two quintiles (40% of Australians). Specifically, mortgage stress levels rose by 5.0% in the E Quintile and 5.2% in the FG Quintile. Sluggish income growth was a major contributing factor, compounded by declining employment.
“While household income among mortgage holders overall rose by 7% over the year to June 2025, those in the E and FG quintiles saw only modest gains of +1.5% and +2.1%, respectively. Additionally, while full-time employment among mortgage holders remained broadly stable (+0.2%), it declined sharply in the lower quintiles falling by -1.3% in the E Quintile and a significant -11.6% in the FG Quintile.”
These latest findings come from the Roy Morgan Single Source survey, derived from in-depth interviews with over 60,000 Australians each year.
Related research findings
For further in-depth analysis, view the various Banking and Finance Currency Reports.
For comments or more information about Roy Morgan Small Business Research data please contact:
Roy Morgan Enquiries
Office: +61 (3) 9224 5309
askroymorgan@roymorgan.com
About Roy Morgan
Roy Morgan is Australia’s largest independent Australian research company, with offices in each state, as well as in the U.S. and U.K. A full-service research organisation, Roy Morgan has over 80 years’ experience collecting objective, independent information on consumers.
[1] "Extremely at Risk" is based on those paying more than a certain proportion of their after-tax household income into their home loan, based on the Standard Variable Rate set by the RBA and the amount now outstanding on their home loan.
[2] "At Risk" is based on those paying more than a certain proportion of their after-tax household income (25% to 45% depending on income and spending) into their home loan, based on the appropriate Standard Variable Rate reported by the RBA and the amount they initially borrowed.
[3] Respondents are allocated scores for each of their income, education and occupation. The respondent’s scores for each of the three categories are then tallied to give a score out of 180. We then look at the frequency distribution of the scores and divide the population into five even groups of 20%, i.e. quintiles. The AB quintile is the highest level - people in this quintile have the highest scores.
Margin of Error
The margin of error to be allowed for in any estimate depends mainly on the number of interviews on which it is based. Margin of error gives indications of the likely range within which estimates would be 95% likely to fall, expressed as the number of percentage points above or below the actual estimate. Allowance for design effects (such as stratification and weighting) should be made as appropriate.
| Sample Size | Percentage Estimate |
| 40% – 60% | 25% or 75% | 10% or 90% | 5% or 95% | |
| 1,000 | ±3.0 | ±2.7 | ±1.9 | ±1.3 |
| 5,000 | ±1.4 | ±1.2 | ±0.8 | ±0.6 |
| 7,500 | ±1.1 | ±1.0 | ±0.7 | ±0.5 |
| 10,000 | ±1.0 | ±0.9 | ±0.6 | ±0.4 |
| 20,000 | ±0.7 | ±0.6 | ±0.4 | ±0.3 |
| 50,000 | ±0.4 | ±0.4 | ±0.3 | ±0.2 |


