ANZ-Roy Morgan Consumer Confidence is virtually unchanged at 70.7 in mid-June
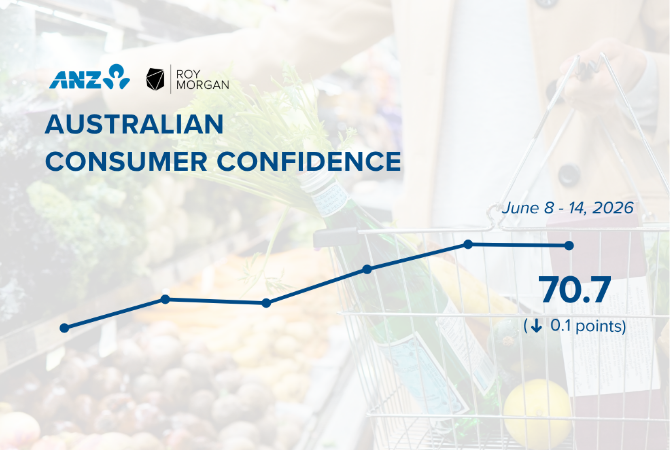
ANZ-Roy Morgan Consumer Confidence was virtually unchanged at 70.7 in mid-June, down 0.1pts from a week ago. Consumer Confidence is 14.7pts lower than a year ago, June 9-15, 2025 (85.4), and just 0.4pts below the 2026 weekly average of 71.1.
An analysis by State shows Consumer Confidence increased in New South Wales, Victoria, and South Australia, but down in Queensland, and Western Australia.
Although Consumer Confidence was unchanged over the week, there was a slight improvement in relation to personal finances and a fifth straight weekly increase in net buying conditions, offset by a decline in net views concerning the Australian economy’s fortunes going forward.
Now just 17% (up 2ppts) of Australians say their families are ‘better off’ financially than this time last year compared to a majority of 54% (down 1ppt) that say their families are ‘worse off’.
Net views on personal finances over the next year were virtually unchanged this week with 21% (down 1ppt) of respondents expecting their family will be ‘better off’ financially this time next year, while 43% (unchanged), expect to be ‘worse off’.
Net sentiment regarding the economy over the next year was little changed this week with 6% (unchanged) of Australians, expecting ‘good times’ compared to 46% (up 1ppt), that expect ‘bad times’.
Net views regarding the Australian economy over the next five years deteriorated this week with 8% (unchanged) of Australians expecting ‘good times’ for the economy over the next five years compared to almost a third, 30% (up 2ppts), expecting ‘bad times’.
Net buying intentions improved for a fifth straight week with 19% (unchanged) of respondents saying now is a ‘good time to buy’ major household items compared to 44% (down 1ppt) that say now is a ‘bad time to buy major household items’.
ANZ Economist, Sophia Angala, commented:

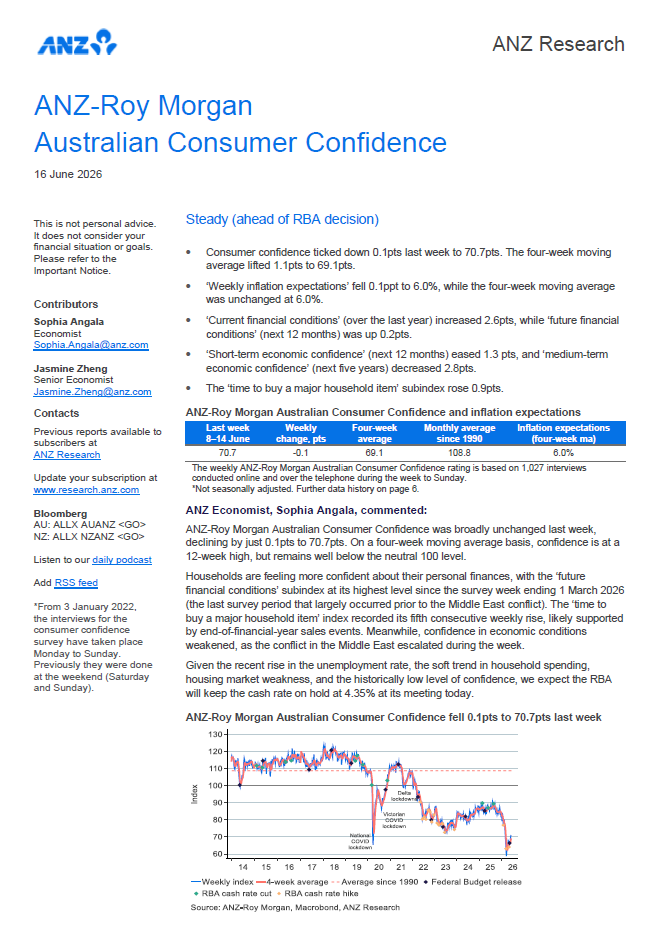
“ANZ-Roy Morgan Australian Consumer Confidence was broadly unchanged last week, declining by just 0.1pts to 70.7pts. On a four-week moving average basis, confidence is at a 12-week high, but remains well below the neutral 100 level.
Households are feeling more confident about their personal finances, with the ‘future financial conditions’ subindex at its highest level since the survey week ending 1 March 2026 (the last survey period that largely occurred prior to the Middle East conflict). The ‘time to buy a major household item’ index recorded its fifth consecutive weekly rise, likely supported by end-of-financial-year sales events. Meanwhile, confidence in economic conditions weakened, as the conflict in the Middle East escalated during the week.
Given the recent rise in the unemployment rate, the soft trend in household spending, housing market weakness, and the historically low level of confidence, we expect the RBA will keep the cash rate on hold at 4.35% at its meeting today.”
Check out the latest results for our weekly surveys on Business Confidence, Consumer Confidence, and Voting Intention as follows:
Roy Morgan Business Confidence Statistics
ANZ – Roy Morgan Consumer Confidence Statistics
Federal Voting – Government Confidence Rating
Related Research Reports
The latest Roy Morgan Consumer Confidence Monthly Report is available on the Roy Morgan Online Store. It provides demographic breakdowns for Age, Sex, State, Region (Capital Cities/ Country), Generations, Lifecycle, Socio-Economic Scale, Work Status, Occupation, Home Ownership, Voting Intention, Roy Morgan Value Segments and more
Consumer Confidence – Monthly Detailed Report in Australia.
Business Confidence – Monthly Detailed Report in Australia.
Consumer Banking Satisfaction - Monthly Report in Australia.
For comments or more information please contact:
Roy Morgan - Enquiries
Office: +61 (03) 9224 5309
askroymorgan@roymorgan.com
Margin of Error
The margin of error to be allowed for in any estimate depends mainly on the number of interviews on which it is based. Margin of error gives indications of the likely range within which estimates would be 95% likely to fall, expressed as the number of percentage points above or below the actual estimate. Allowance for design effects (such as stratification and weighting) should be made as appropriate.
| Sample Size | Percentage Estimate |
| 40% – 60% | 25% or 75% | 10% or 90% | 5% or 95% | |
| 1,000 | ±3.0 | ±2.7 | ±1.9 | ±1.3 |
| 5,000 | ±1.4 | ±1.2 | ±0.8 | ±0.6 |
| 7,500 | ±1.1 | ±1.0 | ±0.7 | ±0.5 |
| 10,000 | ±1.0 | ±0.9 | ±0.6 | ±0.4 |
| 20,000 | ±0.7 | ±0.6 | ±0.4 | ±0.3 |
| 50,000 | ±0.4 | ±0.4 | ±0.3 | ±0.2 |


