Labor holds a large lead among Chinese-born Australians, but Indian-born voters remain up for grabs

New research into the voting trends of Australians during the last two years (July 2023-June 2025) reveals clear differences in voting intentions among Australian electors born in China and India, with significant variation by age group.
Among Chinese-born Australians, 48% support the ALP, compared to 34% for the Liberal-National Coalition and 11% for the Greens, a pattern that is far more favourable to the ALP than the results at the May 2025 Federal Election: ALP (34.6%); Liberal-National Coalition (31.8%), Greens (12.2%).
For Indian-born Australians, 45% support the ALP, compared to 39% for the Liberal-National Coalition and 8% for the Greens, a more balanced result than among Chinese-born voters. Combined support for the two major parties (84%) is far higher than the result at the recent Federal Election (66.4%).
Chinese-born Australian voters aged 35-49 are the most favourable for the ALP
Support for the ALP among Chinese-born Australians peaks in the 35–49yr old age group at 55% (more than 20% points above the national result for the ALP at the Federal Election), with the Liberal-National Coalition on 31% and the Greens on 7%.
Among Chinese-born electors aged 50+, the ALP scores 50%, the Liberal-National Coalition outperforms its Federal Election result at 37%, while the support for the Greens is at only 2%.
Chinese-born electors by first party preference and age
ALP support is lowest among younger Chinese-born voters. For Chinese-born 18–24yr olds, support is split almost evenly between Labor (33%) and the Liberal-National Coalition (34%) and the Greens attract a significant share of 27% – more than 14% points above their national vote at the recent Federal Election.
For Chinese-born 25–34yr olds, ALP support is at 44%, ahead of the Liberal-National Coalition on 38%, while support for the Greens is at 14%.
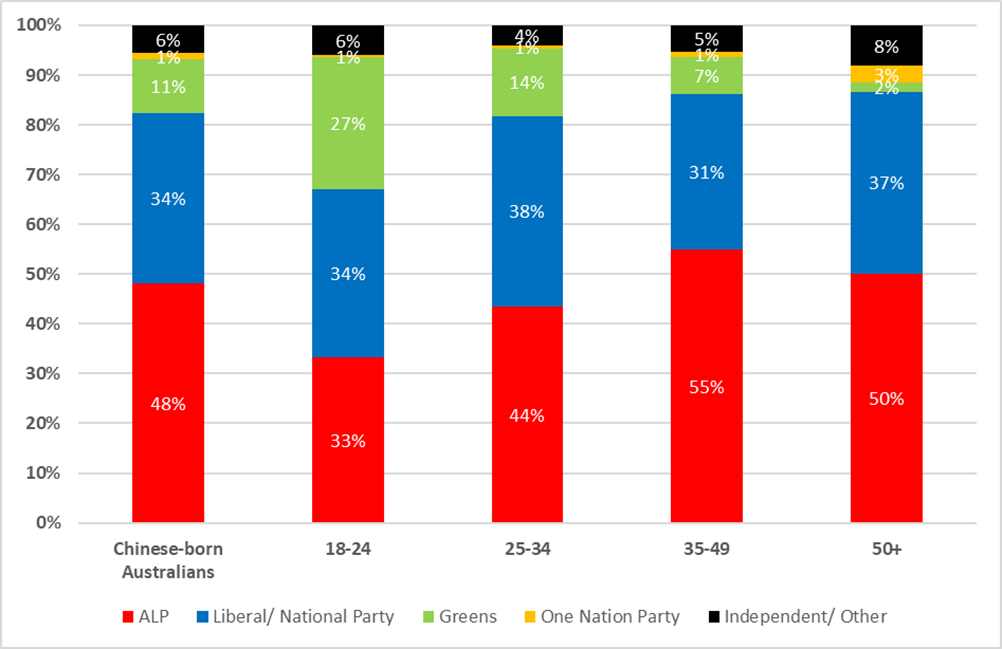
Source: Roy Morgan Single Source (Australia). Base: Australian electors aged 18+, born in China (PRC) between July 2023 and June 2025), Chinese born electors (n = 738).
Indian-born voters are more evenly divided between the two major parties
Among Indian-born Australians, 45% support the ALP, compared to 39% for the Liberal-National Coalition and 8% for the Greens, a more balanced result than among Chinese-born voters. Combined support for the two major parties (84%) is far higher than the result at the recent Federal Election (66.4%).
Among Indian-born 18–24yr olds, the ALP leads with 43%, while the Liberal-National Coalition sits at 25% and the Greens at 18%. Notably, 11% of this youngest group support Independents/Other parties, the highest of any age group.
For Indian-born 25–34yr olds, support for the ALP climbs to their highest share of 49%, more than 14% points higher than the national result at the Federal Election, the Liberal-National Coalition holds 36%, and the Greens record 9%.
In the 35–49 age group of Indian-born Australians, the contest tightens with ALP 45% and Liberal-National Coalition 41%, while the Greens are at 8%. Among those 50 and over, the Liberal-National Coalition leads with 44% (more than 12% points above its Federal Election result), narrowly ahead of the ALP on 42%, while the Greens fall to only 4%, and Independent and other parties have 9% of the vote.
Indian-born electors by first party preference and age
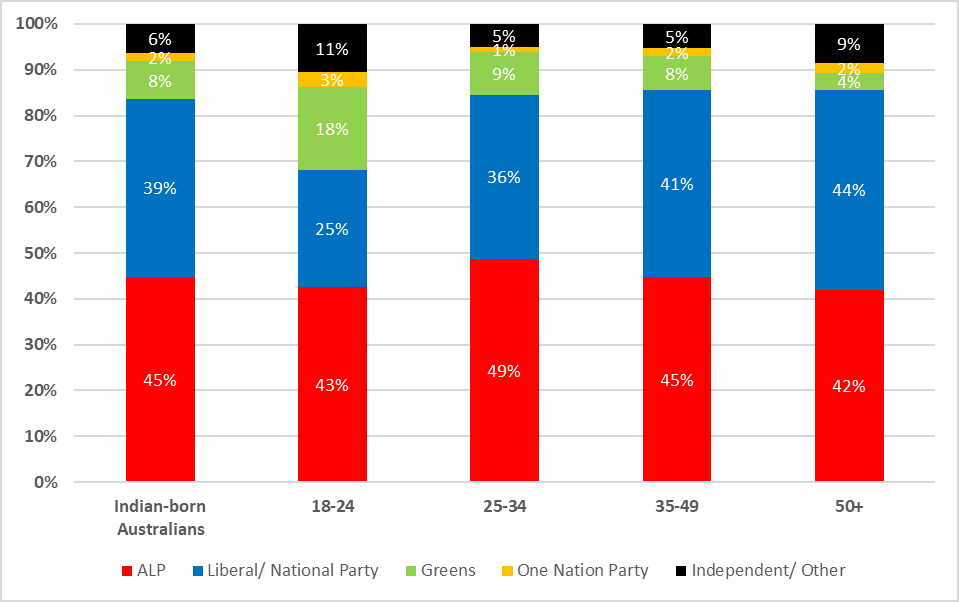
Source: Roy Morgan Single Source (Australia). Base: Australian electors aged 18+, between July 2023 and June 2025, Indian born electors: (n = 1,332).
Overall, the findings highlight a clear contrast: Chinese-born Australians lean consistently towards Labor with strong age-based peaks, while Indian-born Australians present a more competitive landscape, with younger voters backing Labor but older generations shifting towards the Liberal-National Coalition.
This contrast becomes even sharper when compared to the May 2025 Federal Election, where the ALP secured 34.6%, the Liberal/National Coalition 31.8%, and the Greens 12.2%.
Taken together, the data shows that Chinese-born Australians tilt strongly toward Labor with the party polling 10–20% points above their result at the recent Federal Election for all age groups aged 25+.
However, Indian-born Australians are more evenly split between the two major parties and closer to the national picture overall. Younger voters aged 18-24 are far more likely to vote for the Greens than their older counterparts among both Indian-born and Chinese-born Australians – a trend that resembles voting trends among the wider population.
Roy Morgan CEO Michele Levine says the voting trends of immigrants to Australia – and especially Indian Australians – has been in the national spotlight recently with controversial comments made by Northern Territory Liberal Senator Jacinta Nampijinpa Price:

“Last week, Senator Nampijinpa Price claimed[1] ‘a recent Redbridge poll told us that 85% of those who have Indian ancestry … voted for Labor (on a two-party preferred basis)’. However, Roy Morgan’s in-depth analysis, based on electors born in India, shows that while Labor does lead the Liberal-National Coalition among Indian Australians, the figure of 85% is clearly inaccurate.
“Among Indian-born voters Labor (45%) leads the Liberal-National Coalition (39%) by 6% points on primary vote based on interviewing conducted over the last two years (July 2023 – June 2025).
“Labor’s best result among Indian-born voters is for those aged 25-34 at which the Labor vote peaks at 49% compared to the Coalition (36%) – a lead of 13% points. Even this result is well short of a two-party preferred result of ALP (85%) cf. L-NP (15%) as suggested by the Redbridge polling.
“A key take-out from looking at the political preferences of Indian-born Australians is that they favour the two major parties over Independents/Other parties and the Greens. Among Indian-born Australians a striking 84% support either the ALP or Coalition compared to the combined result at the recent Federal Election of 66.4% – a difference of over 17% points in favour of the major parties.
“Labor performs more strongly among Chinese-born voters with support at 48% compared to Liberal-National Coalition support at 34% – a Labor lead of 14% points and twice as large as the Labor lead among Indian-born voters (6% points).
“Among Chinese-born voters Labor performs most strongly in the 35-49yr old age group reaching a high of 55% compared to 31% that support the Coalition – a Labor lead of 24% points.
“The latest ABS data on Australians by country of birth (June 2024)[2] shows Indian-born Australians numbering 916,000 (2nd overall) and Chinese-born Australians numbering 700,000 (3rd overall). The largest migrant group remains Australians born in England numbering 1,011,000.
“Looking forward and with migration from China and India continuing to rise, these voters are an increasingly pivotal segment of the electorate, and their influence is set to grow in the years ahead as new citizens register to vote, making them a key focus for all parties.”
For comments or more information about Roy Morgan’s data please contact Andrew Calvert-Jones or Julian McCrann for more details.
Reports available for sale:
The latest Roy Morgan data is available on the Roy Morgan Online Store. It provides demographic breakdowns for Age, Sex, State, Region (Capital Cities/ Country), Generations, Lifecycle, Socio-Economic Scale, Work Status, Occupation, Home Ownership, Voting Intention, Roy Morgan Value Segments, Helix Personas, Media Consumption, and more.
About Roy Morgan
Roy Morgan is Australia’s largest independent Australian research company, with offices in each state, as well as in the U.S. and U.K. A full-service research organisation, Roy Morgan has over 80 years’ experience collecting objective, independent information on consumers.
[1] Senator Jacinta Nampijinpa Price - Doorstop interview, Parliament House, 4 September 2025. https://www.jacintaprice.com/doorstop_interview_parliament_house_4_september_2025.
[2] ABS: Australia's population by country of birth. Reference Period: June 2024. https://www.abs.gov.au/statistics/people/population/australias-population-country-birth/latest-release
Margin of Error
The margin of error to be allowed for in any estimate depends mainly on the number of interviews on which it is based. Margin of error gives indications of the likely range within which estimates would be 95% likely to fall, expressed as the number of percentage points above or below the actual estimate. Allowance for design effects (such as stratification and weighting) should be made as appropriate.
| Sample Size | Percentage Estimate |
| 40% – 60% | 25% or 75% | 10% or 90% | 5% or 95% | |
| 1,000 | ±3.0 | ±2.7 | ±1.9 | ±1.3 |
| 5,000 | ±1.4 | ±1.2 | ±0.8 | ±0.6 |
| 7,500 | ±1.1 | ±1.0 | ±0.7 | ±0.5 |
| 10,000 | ±1.0 | ±0.9 | ±0.6 | ±0.4 |
| 20,000 | ±0.7 | ±0.6 | ±0.4 | ±0.3 |
| 50,000 | ±0.4 | ±0.4 | ±0.3 | ±0.2 |


