Sydney and Brisbane CBD workers surge while Melbourne struggles to regain pre-pandemic heights

Roy Morgan research reveals that Australia’s central business districts (CBD) workforces have seen strong long-term growth over the past two decades, with most capital city centres now surpassing their pre-pandemic peaks. However, Melbourne is the notable exception, which remains below its pre-pandemic peak as most capital city CBD’s power ahead.
In 2003–04, fewer than one million (974,000) Australians worked in CBDs. Since then, the total has more than doubled to a record 2.2 million in 2024–25, driven largely by Australia’s population growth (7.5 million since June 2004). *
Melbourne’s CBD workforce expanded significantly over the past two decades, more than doubling from 246,000 in 2003–04 to 614,000 in 2019–20.
However, the pandemic had a disproportionate impact on Melbourne compared with other capitals. Worker numbers declined by nearly 100,000 within two years, reaching 519,000 in 2021–22, largely due to extended lockdowns and slower office re-entry. The workforce has since recovered to 577,000 but remains 37,000 below the pre-pandemic peak. Melbourne also continues to record the highest office vacancy rate nationally. *
Sydney’s CBD workforce has surged from 283,000 workers in 2003–04 to 670,000 in 2024–25, rebounding strongly after a small pandemic dip and cementing its position as Australia’s largest CBD workforce, now 93,000 ahead of Melbourne.
Brisbane’s CBD workforce has more than doubled, from 125,000 to 320,000, with rapid post-pandemic growth. Perth’s CBD workforce has climbed to 229,000, Adelaide’s CBD workforce to nearly 200,000, and the CBD workforce in both Hobart and Darwin have reached record highs. Canberra’s CBD workforce remains steady, supported largely by the public service (68% of Canberra CBD workers).
Number (‘000) of Australian CBD workers by major city postcode
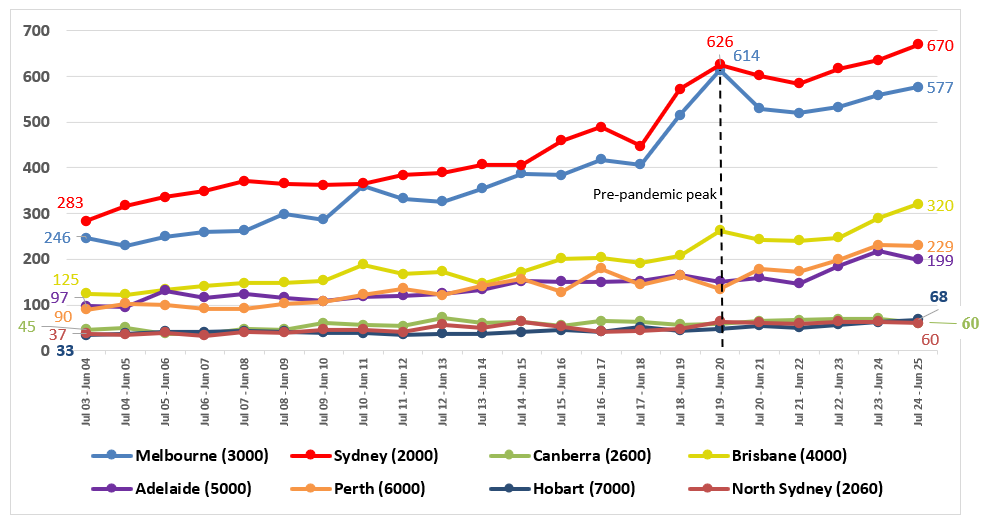
Source: Roy Morgan Single Source (Australia). Base: Australian, full and part-time CBD workers aged 14+ between July 2003 and June 2025, average annual interviews (n= 30,988), total: (n= 681,745).
Roy Morgan CEO Michele Levine says:

“Over the past 20 years, Australia’s CBD workforces have more than doubled to a record 2.2 million, rising from 10% of the national workforce in 2003–04 to 15% today.
“Sydney and Brisbane’s CBDs are booming, Perth and Adelaide are growing, and even the smaller CBDs of Hobart and Darwin have reached record highs. The standout exception is Melbourne, which remains almost 40,000 workers below its pre-pandemic peak after enduring some of the longest lockdowns in the country.
“Australia’s rapid population growth, combined with the shift to working from home, is reshaping the way our cities and CBDs operate.”
For comments or more information about Roy Morgan’s data please contact Andrew Calvert-Jones or Julian McCrann for more details.
Reports available for sale:
The latest Roy Morgan data is available on the Roy Morgan Online Store. It provides demographic breakdowns for Age, Sex, State, Region (Capital Cities/ Country), Generations, Lifecycle, Socio-Economic Scale, Work Status, Occupation, Home Ownership, Voting Intention, Roy Morgan Value Segments, Helix Personas, Media Consumption, and more.
Related Research:
About Roy Morgan
Roy Morgan is Australia’s largest independent Australian research company, with offices in each state, as well as in the U.S. and U.K. A full-service research organisation, Roy Morgan has over 80 years’ experience collecting objective, independent information on consumers.
Margin of Error
The margin of error to be allowed for in any estimate depends mainly on the number of interviews on which it is based. Margin of error gives indications of the likely range within which estimates would be 95% likely to fall, expressed as the number of percentage points above or below the actual estimate. Allowance for design effects (such as stratification and weighting) should be made as appropriate.
| Sample Size | Percentage Estimate |
| 40% – 60% | 25% or 75% | 10% or 90% | 5% or 95% | |
| 1,000 | ±3.0 | ±2.7 | ±1.9 | ±1.3 |
| 5,000 | ±1.4 | ±1.2 | ±0.8 | ±0.6 |
| 7,500 | ±1.1 | ±1.0 | ±0.7 | ±0.5 |
| 10,000 | ±1.0 | ±0.9 | ±0.6 | ±0.4 |
| 20,000 | ±0.7 | ±0.6 | ±0.4 | ±0.3 |
| 50,000 | ±0.4 | ±0.4 | ±0.3 | ±0.2 |


