


ANZ-Roy Morgan Consumer Confidence up 1pt to 77.5 – highest rating since the Iran War began in late February

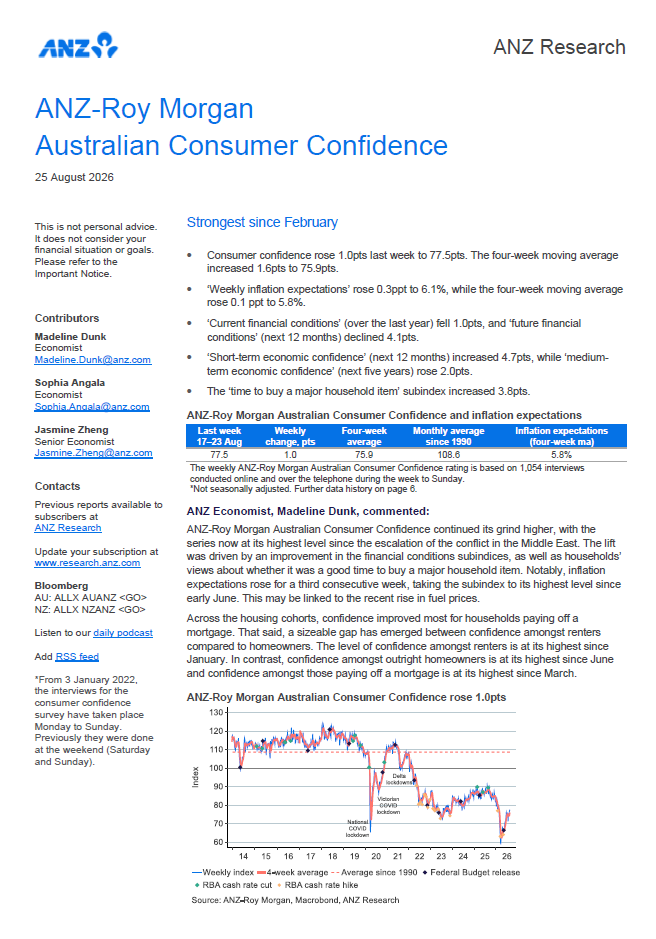
ANZ-Roy Morgan Consumer Confidence increased 1pt to 77.5 in late August in the week after the Reserve Bank left interest rates unchanged at 4.35%. Consumer Confidence is now at its highest since the Iran War began in late February but is still 8.5pts lower than a year ago, August 18-24, 2025 (86.5), and now 5.2pts above the 2026 weekly average of 72.3.
An analysis by State shows confidence increasing in Western Australia, and South Australia, but virtually unchanged in the three largest States of New South Wales, Victoria, and Queensland.
Consumer Confidence was driven higher this week due to increasing confidence about the performance of the Australian economy over the next year.
The confidence of Renters has now been higher than both Home Owners, and People Paying Off Their Homes for eight straight weeks since early July.
Now 17% (down 1ppt) of Australians say their families are ‘better off’ financially than this time last year compared to 49% (unchanged) that say their families are ‘worse off’.
Views on personal finances over the next year deteriorated this week with 21% (down 4ppts) of respondents expecting their family will be ‘better off’ financially this time next year, while 37% (up 1ppt), expect to be ‘worse off’.
Net sentiment regarding the economy over the next year improved this week with 8% (up 2pps) of Australians, expecting ‘good times’ compared to 35% (down 3ppts), that expect ‘bad times’, the best results for these indicators since before the Iran War in mid-February.
There is little change when it comes to Australians’ views about the economy’s performance over the next five years with 9% (unchanged) of Australians expecting ‘good times’ for the economy over the next five years compared to just over a quarter, 27% (down 1ppt), expecting ‘bad times’.
Net buying intentions improved significantly this week with 20% (up 3ppts) of respondents saying now is a ‘good time to buy’ major household items compared to 39% (down 2ppts) that say now is a ‘bad time to buy major household items’.
ANZ Economist, Sophia Angala, commented:

“ANZ-Roy Morgan Australian Consumer Confidence continued its grind higher, with the series now at its highest level since the escalation of the conflict in the Middle East. The lift was driven by an improvement in the financial conditions subindices, as well as households’ views about whether it was a good time to buy a major household item. Notably, inflation expectations rose for a third consecutive week, taking the subindex to its highest level since early June. This may be linked to the recent rise in fuel prices.
Across the housing cohorts, confidence improved most for households paying off a mortgage. That said, a sizeable gap has emerged between confidence amongst renters compared to homeowners. The level of confidence amongst renters is at its highest since January. In contrast, confidence amongst outright homeowners is at its highest since June and confidence amongst those paying off a mortgage is at its highest since March.”
Check out the latest results for our weekly surveys on Business Confidence, Consumer Confidence, and Voting Intention as follows:
Roy Morgan Business Confidence Statistics
ANZ – Roy Morgan Consumer Confidence Statistics
Federal Voting – Government Confidence Rating
Related Research Reports
The latest Roy Morgan Consumer Confidence Monthly Report is available on the Roy Morgan Online Store. It provides demographic breakdowns for Age, Sex, State, Region (Capital Cities/ Country), Generations, Lifecycle, Socio-Economic Scale, Work Status, Occupation, Home Ownership, Voting Intention, Roy Morgan Value Segments and more
Consumer Confidence – Monthly Detailed Report in Australia.
Business Confidence – Monthly Detailed Report in Australia.
Consumer Banking Satisfaction - Monthly Report in Australia.
For comments or more information please contact:
Roy Morgan - Enquiries
Office: +61 (03) 9224 5309
askroymorgan@roymorgan.com
Margin of Error
The margin of error to be allowed for in any estimate depends mainly on the number of interviews on which it is based. Margin of error gives indications of the likely range within which estimates would be 95% likely to fall, expressed as the number of percentage points above or below the actual estimate. Allowance for design effects (such as stratification and weighting) should be made as appropriate.
| Sample Size | Percentage Estimate |
| 40% – 60% | 25% or 75% | 10% or 90% | 5% or 95% | |
| 1,000 | ±3.0 | ±2.7 | ±1.9 | ±1.3 |
| 5,000 | ±1.4 | ±1.2 | ±0.8 | ±0.6 |
| 7,500 | ±1.1 | ±1.0 | ±0.7 | ±0.5 |
| 10,000 | ±1.0 | ±0.9 | ±0.6 | ±0.4 |
| 20,000 | ±0.7 | ±0.6 | ±0.4 | ±0.3 |
| 50,000 | ±0.4 | ±0.4 | ±0.3 | ±0.2 |


