Australians have 209 million days of annual leave due

New data from Roy Morgan shows over 9.7 million Australians in paid employment now have 209 million days of annual leave due; up from 200 million days two years ago, but down from a recent high earlier this year as full-time employment has fallen during 2025.
There are a further 5.2 million workers in paid employment who have no leave. The accrued annual leave of 209 million days is down slightly from the record high reached in the March 2025 of 216 million days. However, the latest figure represents an increase of 9 million (+4.5%) on the 200 million days of accrued annual leave Australians had available in September 2023 two years ago.
Over the last four years the average days of annual leave due per worker has remained virtually unchanged at 14 days but the overall total has increased, until early this year, as the workforce swelled.
However, this steady ascent in the post-pandemic period has stalled this year as full-time employment – to which the most annual leave entitlements accrue – has declined and been replaced by rising part-time employment. In our latest Roy Morgan employment release we noted this factor of increasing casualization of the workforce at play – ‘Overall Australian unemployment and under-employment at 3.28 million in October – 11th straight month above 3 million.’
Total Annual leave accrued owed to Australia's paid workers (2019-2025)

Source: Roy Morgan Single Source (Australia), April 2018 – September 2025. Average number of interviews for each 12 -month period, n=28,902. Base: Australians 14+ in paid employment are entitled to leave.
A large cohort of 5.2 million Australians (34.7% of paid workers) have no annual leave due, up slightly from the 5.1 million (36.7%) without any annual leave two years ago – although this now represents a smaller share of the growing workforce.
A small majority of the workforce, now 7.6 million Australians (51% of paid workers), have at least 2 weeks of annual leave due. This is up from 7 million (50.6%) two years ago with the increase driven entirely by the larger pool of workers while the share has remained virtually unchanged.
The largest increase has been for those workers with less than 2 weeks of annual leave due, now numbering 2 million (13.7% of paid workers), up from 1.8 million (12.7%) two years ago.
In addition, there’s a decrease in the share of workers with the largest amount of annual leave due – those workers with greater than 7 weeks of annual leave due, down from (1.59 million, 11.4% of paid workers) two years ago to 1.51 million (10.1%) today.
Annual leave owed to Australia’s paid workers by length of time (2025 vs. 2023)
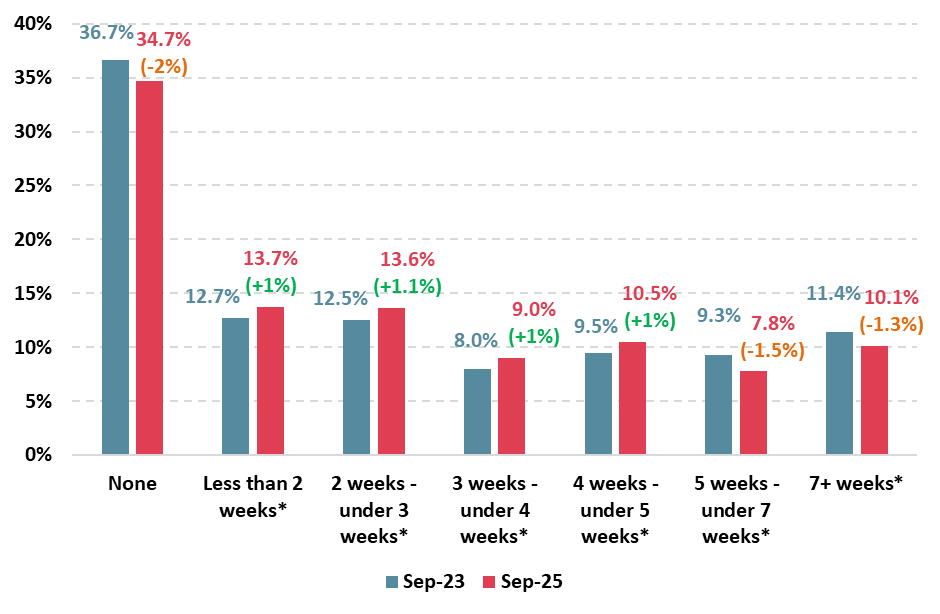
Source: Roy Morgan Single Source (Australia), October 2023 – September 2024, n=40,959, October 2024 – September 2025 n=40,902. Average number of interviews for each 12 - month period, n=37,517. Base: Australians 14+ in paid employment. *Annual leave owed is calculated based on (working) days owed. Less than 2 weeks: 1-9 days; 2 weeks – under 3 weeks: 10-14 days; 3 weeks – under 4 weeks: 15-19 days; 4 weeks – under 5 weeks: 20-24 days; 5 weeks – under 7 weeks: 25-34 days; 7+ weeks: 35+ days.
Roy Morgan CEO Michele Levine says that Australians are approaching the 2024/25 summer break with a near record 209 million days of annual leave saved – up 9 million days from two years ago and up around 60 million days since the pandemic in late 2020:

“The annual leave Australians have accrued soared from 2020-2023 and has continued to rise during 2023-2025 during a protracted cost of living crisis for many Australians. Only recently have the increases in annual leave days due stalled – due to a change in employment composition.
“In September 2025 Australians had accrued 209 million days of annual leave – down slightly from the record 216 million days in early 2025, but an increase of 9 million days (+4.5%) compared to two years ago, and up a significant 60 million days (+39.5%) from five years ago.
“The bulk of this increase occurred during the pandemic years (2020-2022) as Australians were forced to stay at home and weren’t allowed to travel internationally, and for much of this time not even allowed to travel interstate either.
“By September 2022, as final pandemic restrictions were lifted, Australians had accrued 192 million days of annual leave. The leave was shared by Australian workers at an average of 14.3 days per worker, up from 12.3 pre-pandemic – an increase of two days per worker during the pandemic.
Since then, although average days of annual leave per worker has stayed relatively consistent at around 14 days, the overall level of accrued annual leave has generally increased due to a rapidly expanding workforce post-pandemic.
“However, during 2025 this steady increases have stalled as the nature of Australia’s employment market has changed. In our most recent Roy Morgan monthly employment estimates for October we noted the changing composition of Australia’s labour markets:
‘A comparison to a year ago shows the nature of the employment market is rapidly shifting with full-time employment down 511,000 from October 2024, but part-time employment increasing by 484,000 over the same period – a net loss in overall employment of 27,000.
‘This shift in the workforce is clear when looking at the share of employed Australians in full-time and part-time employment. The share of employed Australians in part-time employment is now 36.8%, up 3.5% points from a year ago, compared to 63.2% now in full-time employment.’
“These factors are clear when looking at the amount of leave workers tend to have which shows increases for those with 0-5 weeks of annual leave since 2023. Almost half (46.8%) of Australian workers have either 0-2 weeks of annual leave (13.7%, up 1.1% points from 2023), 2-3 weeks (13.6%, up 1.1% points), 3-4 weeks (9%, up 1% point) or 4-5 weeks (10.5%, up 1% point).
“However, there has been a reduction in the share of workers with large amounts of leave – of 5+ weeks or more of leave. Now, under one-in-five workers (17.9%, down 2,8% points from 2023) have 5+ weeks of annual leave. Nevertheless, these potential holidaymakers represent over 1.5 million working Australians and are a lucrative potential market for travel and tourism operators.
“One important factor to take into consideration when looking at the accrued annual leave available to Australians is that over a third of Australian workers actually have no accrued annual leave – now 34.7% of workers.
“In fact, when this large cohort of workers with no annual leave due is removed from the equation the average amount of annual leave due for workers who do have annual leave due rises to around 20 days – equivalent to a four-week holiday.”
Related research findings
View our Roy Morgan Holiday Intention Leading Indicator Report, or profiles of Australians who intend to holiday in various locations, such as Bali, Adelaide, Barossa Valley, Brisbane and many more.
Roy Morgan’s travel and tourism research quantifies the dollar-value of the tourism industry’s diverse markets; and includes detailed information and insights into what activities people look for when travelling, who they travel with, where they get their information, whose advice they seek when planning a holiday and much more.
For further comment or information about Roy Morgan’s travel and tourism data, please contact:
Roy Morgan Enquiries
Office: +61 (3) 9224 5309
askroymorgan@roymorgan.com
Margin of Error
The margin of error to be allowed for in any estimate depends mainly on the number of interviews on which it is based. Margin of error gives indications of the likely range within which estimates would be 95% likely to fall, expressed as the number of percentage points above or below the actual estimate. Allowance for design effects (such as stratification and weighting) should be made as appropriate.
| Sample Size | Percentage Estimate |
| 40% – 60% | 25% or 75% | 10% or 90% | 5% or 95% | |
| 1,000 | ±3.0 | ±2.7 | ±1.9 | ±1.3 |
| 5,000 | ±1.4 | ±1.2 | ±0.8 | ±0.6 |
| 7,500 | ±1.1 | ±1.0 | ±0.7 | ±0.5 |
| 10,000 | ±1.0 | ±0.9 | ±0.6 | ±0.4 |
| 20,000 | ±0.7 | ±0.6 | ±0.4 | ±0.3 |
| 50,000 | ±0.4 | ±0.4 | ±0.3 | ±0.2 |


