


ANZ-Roy Morgan Consumer Confidence down 1.9pts to 72 as confidence about the Australian economy’s performance declines

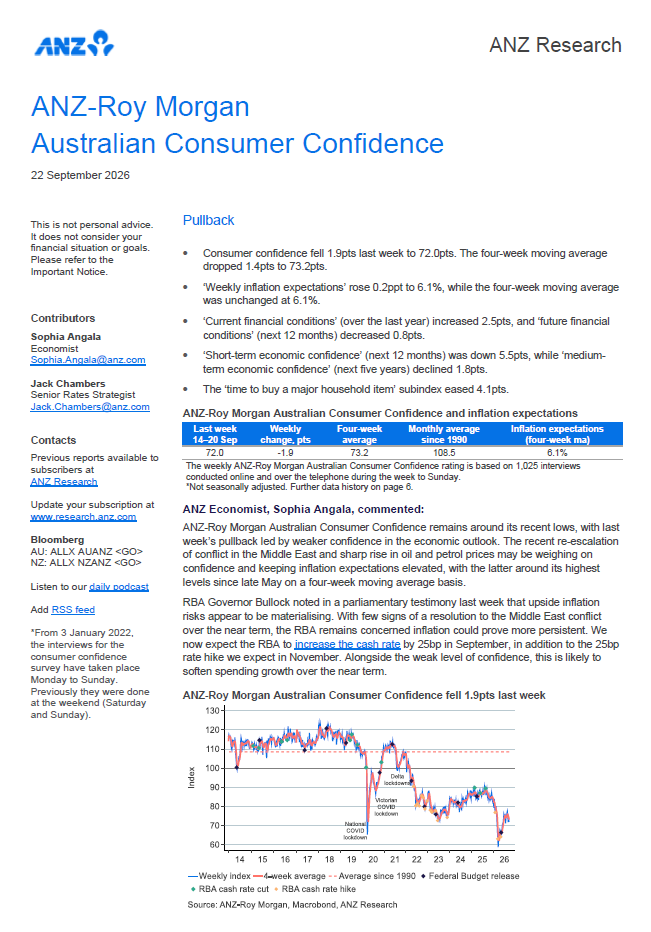
ANZ-Roy Morgan Consumer Confidence decreased 1.9pts to 72 in mid-September. Consumer Confidence is a large 12.6pts lower than a year ago, September 15-21, 2025 (84.6), and just 0.4pts below the 2026 weekly average of 72.4.
An analysis by State shows confidence decreasing in New South Wales, Victoria, and Queensland, but small increases in both Western Australia, and South Australia.
Consumer Confidence was driven lower this week due to less confidence about the Australian economy’s performance over the next year and next five years.
Now almost one-in-five, 19% (up 2ppts), of Australians say their families are ‘better off’ financially than this time last year compared to 50% (down 1ppt) that say their families are ‘worse off’.
Views on personal finances over the next year were virtually unchanged this week with 24% (up 1ppt) of respondents expecting their family will be ‘better off’ financially this time next year, while 41% (up 1ppt), expect to be ‘worse off’.
Net sentiment regarding the economy over the next year declined this week with just 5% (down 3ppts) of Australians, expecting ‘good times’ compared to 44% (up 3ppts), that expect ‘bad times’.
Australians’ views about the economy’s performance over the longer-term of the next five years is virtually unchanged with just 6% (down 2ppts) of Australians expecting ‘good times’ for the economy over the next five years compared to nearly a third, 30% down 1ppt), expecting ‘bad times’.
Net buying intentions were weakened this week with 17% (down 2ppts) of respondents saying now is a ‘good time to buy’ major household items compared to a plurality of 46% (up 3ppts) that say now is a ‘bad time to buy major household items’.
ANZ Economist, Sophia Angala, commented:

“ANZ-Roy Morgan Australian Consumer Confidence remains around its recent lows, with last week’s pullback led by weaker confidence in the economic outlook. The recent re-escalation of conflict in the Middle East and sharp rise in oil and petrol prices may be weighing on confidence and keeping inflation expectations elevated, with the latter around its highest levels since late May on a four-week moving average basis.
“RBA Governor Bullock noted in a parliamentary testimony last week that upside inflation risks appear to be materialising. With few signs of a resolution to the Middle East conflict over the near term, the RBA remains concerned inflation could prove more persistent. We now expect the RBA to increase the cash rate by 25bp in September, in addition to the 25bp rate hike we expect in November. Alongside the weak level of confidence, this is likely to soften spending growth over the near term.”
Check out the latest results for our weekly surveys on Business Confidence, Consumer Confidence, and Voting Intention as follows:
Roy Morgan Business Confidence Statistics
ANZ – Roy Morgan Consumer Confidence Statistics
Federal Voting – Government Confidence Rating
Related Research Reports
The latest Roy Morgan Consumer Confidence Monthly Report is available on the Roy Morgan Online Store. It provides demographic breakdowns for Age, Sex, State, Region (Capital Cities/ Country), Generations, Lifecycle, Socio-Economic Scale, Work Status, Occupation, Home Ownership, Voting Intention, Roy Morgan Value Segments and more
Consumer Confidence – Monthly Detailed Report in Australia.
Business Confidence – Monthly Detailed Report in Australia.
Consumer Banking Satisfaction - Monthly Report in Australia.
For comments or more information please contact:
Roy Morgan - Enquiries
Office: +61 (03) 9224 5309
askroymorgan@roymorgan.com
Margin of Error
The margin of error to be allowed for in any estimate depends mainly on the number of interviews on which it is based. Margin of error gives indications of the likely range within which estimates would be 95% likely to fall, expressed as the number of percentage points above or below the actual estimate. Allowance for design effects (such as stratification and weighting) should be made as appropriate.
| Sample Size | Percentage Estimate |
| 40% – 60% | 25% or 75% | 10% or 90% | 5% or 95% | |
| 1,000 | ±3.0 | ±2.7 | ±1.9 | ±1.3 |
| 5,000 | ±1.4 | ±1.2 | ±0.8 | ±0.6 |
| 7,500 | ±1.1 | ±1.0 | ±0.7 | ±0.5 |
| 10,000 | ±1.0 | ±0.9 | ±0.6 | ±0.4 |
| 20,000 | ±0.7 | ±0.6 | ±0.4 | ±0.3 |
| 50,000 | ±0.4 | ±0.4 | ±0.3 | ±0.2 |


