Rate of switching electricity service providers is higher among owners of ‘Solar Energy Systems’

New data from Roy Morgan shows take-up of solar energy systems increases the propensity of households to switch electricity providers.
In our recent publication: ‘Ownership of ‘Solar Energy Systems’ is on the rise’, we reported that ownership of solar energy systems, which can be solar hot water systems, solar heated swimming pools or rooftop solar panels with or without battery systems, has increased significantly in the last four years.
Around 32% of Australian households now have some form of solar energy system and these figures include 27% of households with rooftop solar panels and 5% with both solar panels and storage batteries.
New data from Roy Morgan shows the take up of solar panels increases the likelihood of consumers to switch to another electricity service provider. Recent solar energy converts are more likely to have switched their electricity service provider than the average household; and they are more likely to be considering switching in the next 12 months. This correlation is likely due to consumers with solar energy systems searching for the best solar energy buy back rate, otherwise known as feed-in tariffs.
To understand switching behaviour among this group of solar panel owners, Roy Morgan analysed the behaviour and intentions of households across Australia excluding households in Western Australia which has a legislated monopoly for electricity supply through the state-owned Synergy.
Likelihood of switching electricity service providers by recent buyers of solar energy systems
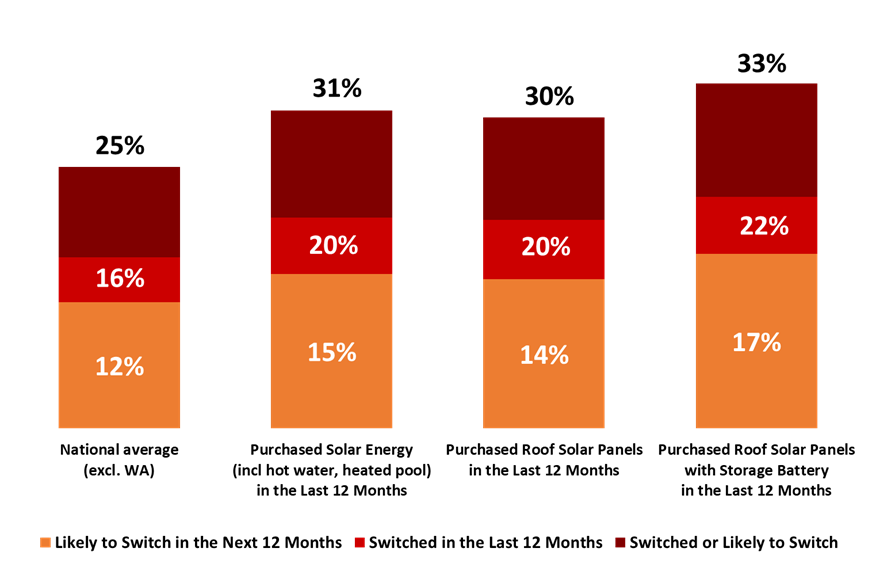
Source: Roy Morgan Single Source. October 2024 – September 2025. Base: Australian households excl. WA connected to electricity n=56,356; Australian households excl. WA that bought any solar energy system (incl solar hot water, solar heated swimming pool) in the last 12 months n=1,191; Australian households excl. WA that bought roof solar panels in the last 12 months n=1,010; Australian households excl. WA that bought roof solar panels with storage battery in the last 12 months n=425.
Rate of switching is highest for households with both solar panels and battery systems
The rate of switching electricity service providers in the last 12 months among households that acquired solar energy systems during the same period (20%) is 4% points higher than the switching rate for all Australian households (16%) outside of Western Australia. The rate of switching is even higher among households with both solar panels and battery systems (22%).
The likelihood to switch in the next 12 months among households with any form of solar energy system (15%) and households with both solar panels and a storage battery (17%) is also higher compared to the likelihood for an average Australian household outside of Western Australia (12%).
A quarter of Australian households outside Western Australia (25%) either switched electricity service providers in the last 12 months or are likely to switch in the next 12 months. Unsurprisingly, this figure rises to 31% among those with any form of solar energy system, and even higher among those with roof solar panels and storage battery system (33%).
Households that switched provider and purchased any solar system in the last 12 months were more likely to choose Alinta or EnergyAustralia for their new provider, and less likely to choose AGL.
Even those looking to acquire solar panels within a year are already planning ahead and considering switching to another electricity service provider.
Households that intend to acquire any solar energy system in the next 12 months are more likely to switch electricity providers in the next year (17%) compared to an average Australian household outside of Western Australia (12%). This likelihood to switch increases to 18% among those intending to purchase solar panels and a battery storage.
Likelihood of switching electricity service providers among households intending to purchase solar panels and solar energy systems in the next 12 months
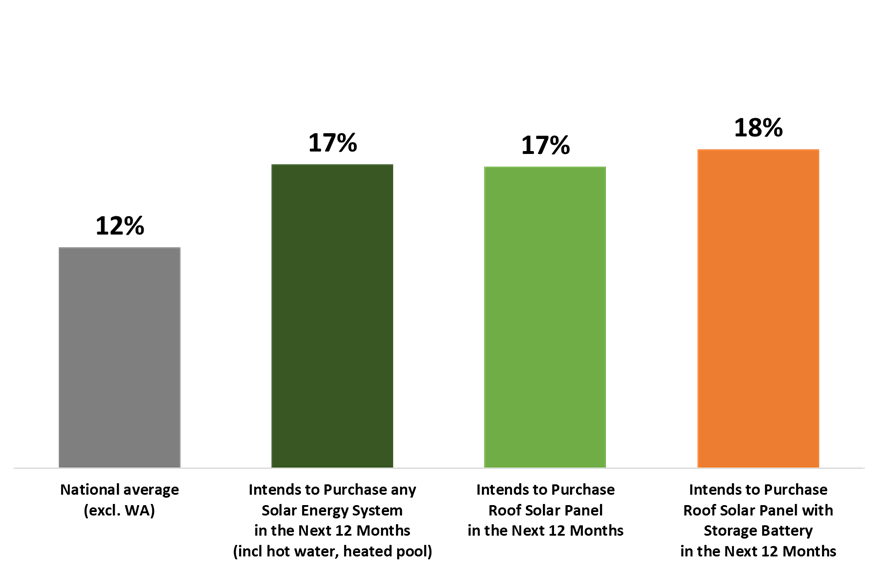
Source: Roy Morgan Single Source. October 2024 – September 2025. Base: Australian households with an electricity service provider excluding those in WA n=56,356; Australian households excl WA that intend to purchase any solar energy system (incl solar hot water, solar heated swimming pool) in the next 12 months n=1,455; Australian household with an electricity service provider and intend to purchase roof solar panels in the next 12 months excluding those in WA n=1,023; Australian household with an electricity service provider and intend to purchase roof solar panels with battery storage in the next 12 months excluding those in WA n=348.
The acquisition of, or intention to buy, solar panels is clearly prompting households to become more engaged with their choice of an electricity service provider to maximise the benefits of their investment.
As ownership rates of solar energy systems continue to grow, the rate of switching electricity providers is set to continue increasing and likely at a higher rate than the current average.
Michele Levine, CEO, Roy Morgan, says acquisition of ‘Solar Energy Systems’ continue to increase with significant government support via rebates and interest-free loans, and these households have a higher propensity to switch electricity providers.

“The latest Roy Morgan data has uncovered interesting relationships between solar energy uptake and switching electricity providers. Outside of WA*, those with any form of solar energy systems have a higher propensity to switch their electricity service providers.
“However, despite these results we expect that the decreasing feed-in tariff from many electricity service providers going forward will crimp the switching behaviour of these households. In fact, some energy retailers have already stopped paying customers for the solar power they generate.
“The data clearly shows that in this challenging economic climate decreasing feed-in tariffs, not just high energy prices, are impacting household decisions. These factors are pushing households to review their plan to make sure they are getting as much return on their investment as possible.
“The latest figures show that those who switched in the last 12 months or are likely to switch in the next 12 months, make up a third of households that recently acquired roof solar panels, this is a significant market of over 120,000 households.
“The Federal Government’s ‘Cheaper Home Batteries Program,’ which launched recently in July 2025 is expected to lead to an even more rapid uptake of solar energy storage battery systems in the coming years. With this continued increase in ownership of solar energy storage battery systems, this will almost certainly drive a substantial increase in the rate of switching electricity providers or even lead to households living completely off the grid.
“To find out the latest detailed data on the behaviour of customers in the electricity market – including solar energy system ownership and switching behaviour of your customers – contact Roy Morgan now.”
To learn more about Roy Morgan Single Source and more, call (+61) (3) 9224 5309 or email askroymorgan@roymorgan.com.
Please click on this link to the Roy Morgan Online Store to view additional in-depth reports and profiles on consumer data in the utility and energy industries.
*In Western Australia the State Government has a legislated monopoly for electricity supply through the state-owned energy company Synergy which prevents households switching provider
About Roy Morgan
Roy Morgan is the largest independent Australian research company, with offices in each state of Australia, as well as in the United States and the United Kingdom. A full-service research organisation specialising in omnibus and syndicated data, Roy Morgan has over 80 years’ experience in collecting objective, independent information on consumers.
Margin of Error
The margin of error to be allowed for in any estimate depends mainly on the number of interviews on which it is based. Margin of error gives indications of the likely range within which estimates would be 95% likely to fall, expressed as the number of percentage points above or below the actual estimate. Allowance for design effects (such as stratification and weighting) should be made as appropriate.
| Sample Size | Percentage Estimate |
| 40% – 60% | 25% or 75% | 10% or 90% | 5% or 95% | |
| 1,000 | ±3.0 | ±2.7 | ±1.9 | ±1.3 |
| 5,000 | ±1.4 | ±1.2 | ±0.8 | ±0.6 |
| 7,500 | ±1.1 | ±1.0 | ±0.7 | ±0.5 |
| 10,000 | ±1.0 | ±0.9 | ±0.6 | ±0.4 |
| 20,000 | ±0.7 | ±0.6 | ±0.4 | ±0.3 |
| 50,000 | ±0.4 | ±0.4 | ±0.3 | ±0.2 |


