New car buying intention falls to a five year low as Australians cut spending amidst economic uncertainty
New Roy Morgan data for March 2026 shows just 16%, or 3.8 million Australians aged 14+, intend to buy a new car in the next four years, down 4% points from a high of 20% in March 2023.
This decline has driven overall buying intention down to 47% (March 2026) from a high of 52% in March 2023. Meanwhile, interest in ‘Used Cars’ remained steady over the last few years with around 1-in-4 Australians (25% in March 2023 to 26% March 2026) saying they are looking to purchase a Used Car in the next 4 years.
Intention to buy a vehicle in the next 4 years – New vs Used
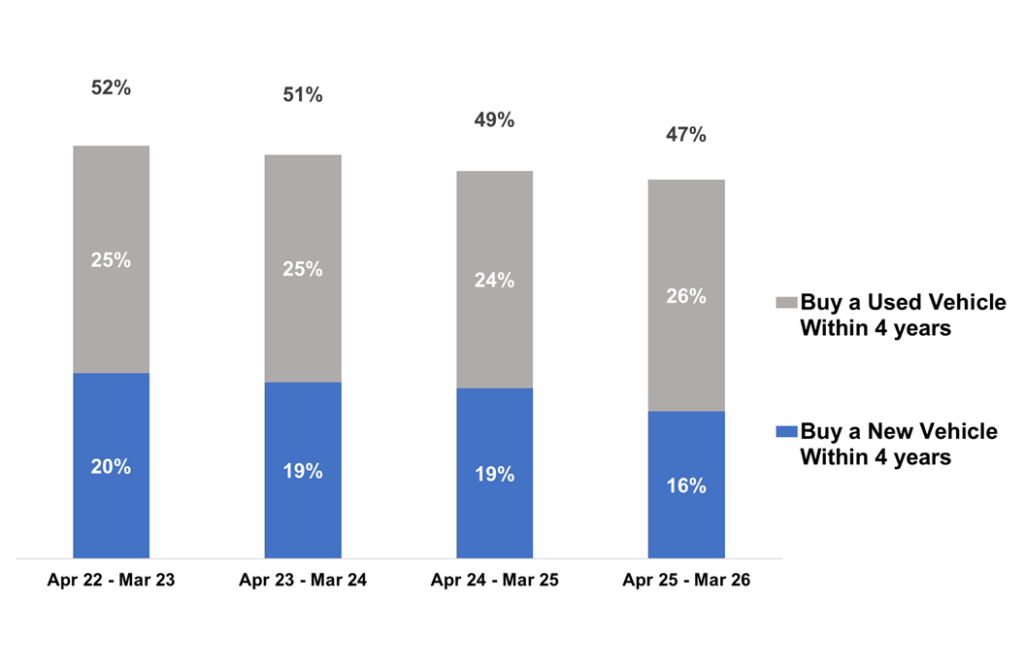
Source: Roy Morgan Single Source (Australia), April 2022 – March 2026. Average number of interviews for each 12 -month period, n=64,868. Base: Australians 14+. Question: How many years is it likely to be before you buy a car for yourself – or replace your own car – or in some other way get a car for yourself? Is it likely to be a used car or a new car?
SUV segment domination grows among those intending to buy a new car in the next four years
Australians are showing an overwhelming preference for Sports Utility Vehicles (SUVs) to meet their new car needs. This has been driven heavily by Medium SUVs, which now have a 26% share of New Car Intenders – even higher than those intending to buy any Passenger Cars (23%).
Medium SUVs have been the top pick of Australians in the last few years with popularity up 6% points from 20% in March 2023. Meanwhile, intention to buy Passenger Cars declined by 7% points during the same period from 30% (March 2023) to 23% now.
This drop was driven by the decline of Small Cars among those intending to buy a new car. The share of New Car Intenders for Small Cars is just 10% today; down significantly by 5% points from 15% in March 2023 when it wasthe second most popular vehicle type most commonly picked behind Medium SUVs.
Manufacturers are entering the Medium SUV space at a huge pace, by introducing new models or entering the Australian market for the first time and hoping to capture a share of the 986,000 Australians in this target group. Large SUVs (12%) and Small SUVs (11%) remain popular and have overtaken the intention to buy Small Cars over the last three years.
New Car Intender Preferences – March 2023 vs March 2026
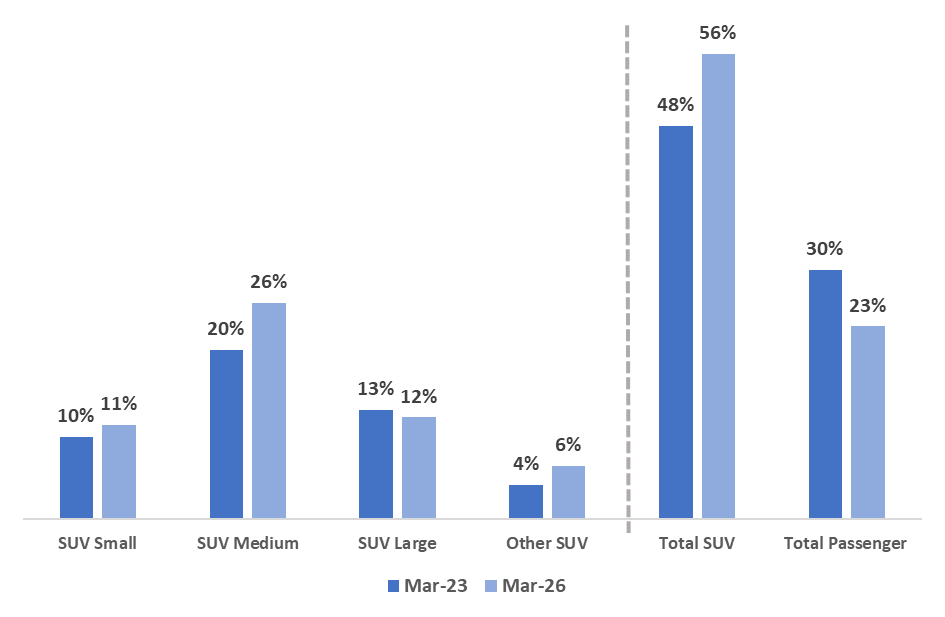
Source: Roy Morgan Single Source (Australia), April 2022 – March 2026. Average number of interviews for each 12 -month period, n=64,868. Base: Australians 14+ intending to buy a new vehicle in the next 4 years.
Michele Levine, CEO, Roy Morgan, says:

“Buying a new car is a big decision. The latest data on car buying intention reflects Australians believe now is not a good time to make big purchase decisions in the middle of a cost-of-living crisis. This is consistent with what we see in our latest ANZ-Roy Morgan Consumer Confidence index – which remains near a record low. Indeed, only 13% say now is a ‘good time to buy major household items’, while the majority (49%) say it is a ‘bad time to buy major household items’.
“The popularity of SUVs remains strong, with the majority of new car intenders (56%) saying they intend to buy an SUV. The increased popularity of Medium SUVs is good news for car manufacturers with models in this category. More importantly, this is an appealing market for Chinese car manufacturers entering an increasingly competitive Australian market which is expected to improve price competition for Medium SUVs.”
For comments or more information about Roy Morgan’s extensive automotive data and insights please contact:
Roy Morgan Enquiries
Office: +61 (3) 9224 5309
askroymorgan@roymorgan.com
About Roy Morgan
Roy Morgan is Australia’s largest independent Australian research company, with offices in each state, as well as in the U.S. and U.K. A full-service research organisation, Roy Morgan has over 80 years’ experience collecting objective, independent information on consumers.
Margin of Error
The margin of error to be allowed for in any estimate depends mainly on the number of interviews on which it is based. Margin of error gives indications of the likely range within which estimates would be 95% likely to fall, expressed as the number of percentage points above or below the actual estimate. Allowance for design effects (such as stratification and weighting) should be made as appropriate.
| Sample Size | Percentage Estimate |
| 40% – 60% | 25% or 75% | 10% or 90% | 5% or 95% | |
| 1,000 | ±3.0 | ±2.7 | ±1.9 | ±1.3 |
| 5,000 | ±1.4 | ±1.2 | ±0.8 | ±0.6 |
| 7,500 | ±1.1 | ±1.0 | ±0.7 | ±0.5 |
| 10,000 | ±1.0 | ±0.9 | ±0.6 | ±0.4 |
| 20,000 | ±0.7 | ±0.6 | ±0.4 | ±0.3 |
| 50,000 | ±0.4 | ±0.4 | ±0.3 | ±0.2 |


