


Inflation and input costs are the biggest challenge facing Australian farmers
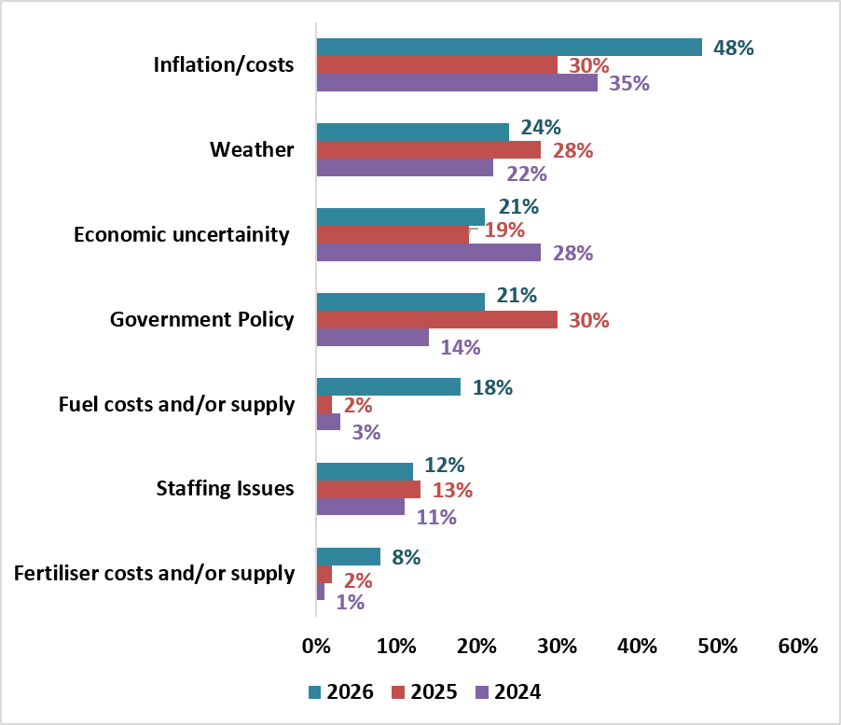
Roy Morgan’s annual Agribusiness survey shows almost half of Australian farmers (48%) name inflation and input costs among their biggest farming challenges, up a sharp 18 percentage points from a year ago. The 48% figure for inflation and input costs is the highest figure any challenge has recorded in the survey’s five-year history.
The second biggest challenge for farmers is weather, mentioned by 24% of farmers, down 4% points. Economic uncertainty and government policy are in equal third place at 21% each. Last year government policy concerns were dominated by the live sheep export ban, while this was less top of mind this year.
Filling out the top seven challenges were fuel costs and supply, mentioned by 18% of farmers, and staffing issues, cited by 12% of farmers. Mention of fuel costs and supply increased by a staggering 16 percentage points from 2% in 2025. Fertiliser costs and supply have also increased, from 2% in 2025 to 8% in 2026.
The results in the Roy Morgan Agribusiness Brand Trust & Health Survey are based on interviews of 1,110 Australian farmers conducted online during July/August 2026
Top seven challenges for Australian farmers led by inflation/input costs
Source: Roy Morgan Agribusiness Brand Trust & Health Survey.
Base: Australian farmers 18+. 2026 n=1,110, 2025 n=1,011, 2024 n=1,035.
Farmers were asked in their own words to describe the biggest challenges they face:

“Inconsistent and unreliable weather. Market uncertainty. Rising farm inputs. The many threats occasioned by the USA under the Trump administration.” (Sheep farmer, TAS).
“Rainfall and grain prices and higher input costs. It is hard to make money as it is going and it won’t be sustainable if it keeps going down this path.” (Broadacre crops, Sheep and Beef farmer, WA).
“Cost of fertilizer and fuel. The fact that cattle prices are still not high enough to keep up with the rapidly rising costs.” (Beef farmer, WA).
“Fuel prices, city environmentalists who don’t know a thing about practical farming.” (Broadacre crops and Sheep farmer, NSW).
“High input costs and low returns on our produce.” (Horticulture, WA).
Australian farmers are worried about their prospects over the next year
A clear majority of Australian farmers (59%) say their farming business is ‘worse off financially’ than a year ago, compared with only 41% who say they are ‘better off’. This is a sharp turnaround from a year ago, when farmers were almost evenly split with 51% saying they were ‘worse off’ and 49% ‘better off’.
Queensland farmers are by far the most pessimistic, with almost three-quarters (73%) saying their business is ‘worse off financially’ than a year ago. South Australia is the only state where a majority of farmers (58%) say they are ‘better off’.
A large majority of farmers (67%) with an annual revenue of less than $100,000 say they are ‘worse off’ than a year ago.
Agricultural business confidence remains well below neutral for four consecutive years
Roy Morgan’s Business Confidence measure for agriculture is at only 63.7 on the three-month rolling average to October 2026, well below the neutral level of 100. Confidence has remained below neutral since mid-2022 and reached its lowest point in at least 15 years in the June quarter of 2026.
Agriculture, forestry and fishing is among the five least confident sectors in the Australian economy. Its confidence reading has fallen by 16.3 points from 80.0 a year earlier.
Source: Roy Morgan Single Source 3-month rolling average to October 2026. Base: Australian businesses (n=3,456). Weighted results.
Roy Morgan CEO Michele Levine says Australian farmers are concerned about the year ahead with 48% mentioning ‘inflation and costs’ as their biggest challenge and 59% who say their farming business is ‘worse off financially than a year ago’:
“The 48% figure for inflation and costs is the highest figure any challenge has recorded in the survey’s five-year history. While inflation and costs includes fuel and fertiliser costs – when we separate these two input costs out we see some big changes. Fuel went from 2% to 18% (an increase of 16% points); fertiliser from 2% to 8% (up 6% points).
“Agribusiness confidence reached its lowest point in at least fifteen years in the June quarter of this year. And it has been in negative territory since the middle of 2022 – four full years in which more farmers have expected things to get worse, not better.
“A single poor quarter could be a blip. Four years below neutral is something else entirely: it is a settled expectation. And confidence, remember, is not a measure of conditions. It is a measure of what people believe is coming — and that is precisely what determines whether farmers plant, buy, hire, or hold back and wait.
“On the latest reading, agriculture is in the five least confident sectors in the Australian economy. Confidence has fallen across the board over the past year – the all-business average is down by almost twenty-four points. Agriculture’s fall is far smaller, at around four points, but take caution against reading that as resilience. It is a floor effect. Agriculture had already made the journey the other sectors are only now making, and it has very little further to fall.”
View the Roy Morgan Farmer Agribusiness Survey 2026 Webinar presented by Roy Morgan CEO Michele Levine here: Roy Morgan Trusted Agribusiness Brand Awards 2026 Webinar.
For more details on trust and distrust in the Agribusiness industry, purchase the Roy Morgan Farmer Agribusiness Insights Report here.
In July/August 2026, 1,110 Australian farmers completed Roy Morgan’s Agribusiness survey, providing insight into farmers’ experience. Farmers from a range of farms participated in the survey – Beef, Cropping, Sheep (meat), Sheep (wool), Horticulture, Dairy and other farm types, small farms to those over 25,000 hectares, annual revenue from under $100,000 to over $5 million.
The Roy Morgan Agribusiness Insights Report details insights into farmers including:
- Brand awareness, usage, consideration and rejection
- Which agribusiness brands farmers trust and distrust, both prompted and unprompted
- Why farmers trust and distrust these brands (verbatims)
- Likelihood to recommend agribusiness brands (Net Promoter Score), and the reasons why (verbatims)
- Key brand attributes when farmers choose brands to work with
- Brand performance on key attributes
- AgTech usage
- Sources of farming information
- Agri-finance products held, value of loans, who they’re with, main financial institution (MFI) and likelihood to remain with MFI
- Business confidence and the biggest challenges for farmers in their own words (verbatims)
- Analysis overall, as well as by farm type, size, revenue, and state
The report includes an executive summary, charts, tables, and commentary summarising key findings.
For more information about Roy Morgan’s Agribusiness Brand Trust & Health survey or tailored farmer research options, contact askroymorgan@roymorgan.com to organise a briefing and learn about the depth of insights Roy Morgan has about your organisation or call on +61 (03) 9224 5309.
About Roy Morgan
Roy Morgan is Australia’s largest independent Australian research company, with offices in each state, as well as in the U.S. and U.K. A full-service research organisation, Roy Morgan has over 80 years of experience collecting objective, independent information on consumers.
Margin of Error
The margin of error to be allowed for in any estimate depends mainly on the number of interviews on which it is based. Margin of error gives indications of the likely range within which estimates would be 95% likely to fall, expressed as the number of percentage points above or below the actual estimate. Allowance for design effects (such as stratification and weighting) should be made as appropriate.
| Sample Size | Percentage Estimate |
| 40% – 60% | 25% or 75% | 10% or 90% | 5% or 95% | |
| 1,000 | ±3.0 | ±2.7 | ±1.9 | ±1.3 |
| 5,000 | ±1.4 | ±1.2 | ±0.8 | ±0.6 |
| 7,500 | ±1.1 | ±1.0 | ±0.7 | ±0.5 |
| 10,000 | ±1.0 | ±0.9 | ±0.6 | ±0.4 |
| 20,000 | ±0.7 | ±0.6 | ±0.4 | ±0.3 |
| 50,000 | ±0.4 | ±0.4 | ±0.3 | ±0.2 |


