ANZ-Roy Morgan Consumer Confidence increases 2.2 points to 64.5 after ceasefire agreement in Middle East
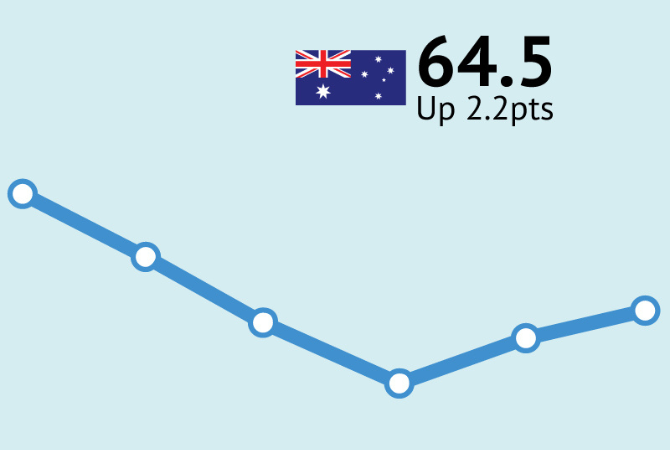
ANZ-Roy Morgan Consumer Confidence was up 2.2 points to 64.5 this week after a ceasefire agreement in the Middle East early last week and follows the cut to the fuel excise the previous week. Consumer Confidence is a large 19.7pts lower than a year ago, April 7-13, 2025 (84.2), and now 9.1pts below the 2026 weekly average of 73.6.
Although a second straight weekly improvement and the highest result for a month, this is the fourth lowest Consumer Confidence in the index stretching back over 50 years since 1972.
An analysis by State shows Consumer Confidence improved in the three largest States of New South Wales, Victoria, and Queensland, unchanged in Western Australia, but down in South Australia.
Driving this week’s increase was due primarily to less negativity about personal finances and the Australian economy over the next year, and next five years.
Fewer than one-in-eight Australians, 12% (down 1ppt), say their families are ‘better off’ financially than this time last year compared to 59% (down 1ppt) that say their families are ‘worse off’.
Net views on personal finances over the next year improved this week with 19% (unchanged) of respondents expecting their family will be ‘better off’ financially this time next year, while 43% (down 4ppts), expect to be ‘worse off’.
Net sentiment regarding the economy over the next year improved this week with 4% (down 1ppt) of Australians, expecting ‘good times’ compared to half, 50% (down 4ppts), that expect ‘bad times’.
Net views regarding the Australian economy over the next five years improved this week with 6% (unchanged) of Australians expecting ‘good times’ for the economy over the next five years compared to over a quarter, 29% (down 3ppts), expecting ‘bad times’.
Net buying intentions improved this week with 14% (down 2ppts) of respondents saying now is a ‘good time to buy’ major household items compared to 51% (down 4ppts) that say now is a ‘bad time to buy major household items’.
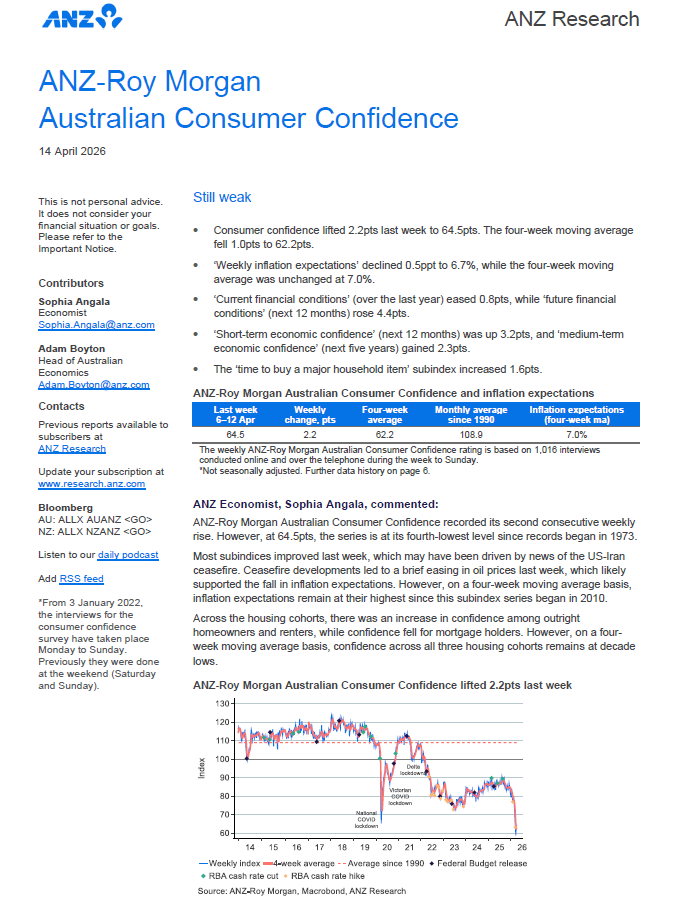
ANZ Economist, Sophia Angala, commented:

ANZ-Roy Morgan Australian Consumer Confidence recorded its second consecutive weekly rise. However, at 64.5pts, the series is at its fourth-lowest level since records began in 1973.
Most subindices improved last week, which may have been driven by news of the US-Iran ceasefire. Ceasefire developments led to a brief easing in oil prices last week, which likely supported the fall in inflation expectations. However, on a four-week moving average basis, inflation expectations remain at their highest since this subindex series began in 2010.
Across the housing cohorts, there was an increase in confidence among outright homeowners and renters, while confidence fell for mortgage holders. However, on a four-week moving average basis, confidence across all three housing cohorts remains at decade lows.
Check out the latest results for our weekly surveys on Business Confidence, Consumer Confidence, and Voting Intention as follows:
Roy Morgan Business Confidence Statistics
ANZ – Roy Morgan Consumer Confidence Statistics
Federal Voting – Government Confidence Rating
Related Research Reports
The latest Roy Morgan Consumer Confidence Monthly Report is available on the Roy Morgan Online Store. It provides demographic breakdowns for Age, Sex, State, Region (Capital Cities/ Country), Generations, Lifecycle, Socio-Economic Scale, Work Status, Occupation, Home Ownership, Voting Intention, Roy Morgan Value Segments and more
Consumer Confidence – Monthly Detailed Report in Australia.
Business Confidence – Monthly Detailed Report in Australia.
Consumer Banking Satisfaction - Monthly Report in Australia.
For comments or more information please contact:
Roy Morgan - Enquiries
Office: +61 (03) 9224 5309
askroymorgan@roymorgan.com
Margin of Error
The margin of error to be allowed for in any estimate depends mainly on the number of interviews on which it is based. Margin of error gives indications of the likely range within which estimates would be 95% likely to fall, expressed as the number of percentage points above or below the actual estimate. Allowance for design effects (such as stratification and weighting) should be made as appropriate.
| Sample Size | Percentage Estimate |
| 40% – 60% | 25% or 75% | 10% or 90% | 5% or 95% | |
| 1,000 | ±3.0 | ±2.7 | ±1.9 | ±1.3 |
| 5,000 | ±1.4 | ±1.2 | ±0.8 | ±0.6 |
| 7,500 | ±1.1 | ±1.0 | ±0.7 | ±0.5 |
| 10,000 | ±1.0 | ±0.9 | ±0.6 | ±0.4 |
| 20,000 | ±0.7 | ±0.6 | ±0.4 | ±0.3 |
| 50,000 | ±0.4 | ±0.4 | ±0.3 | ±0.2 |


