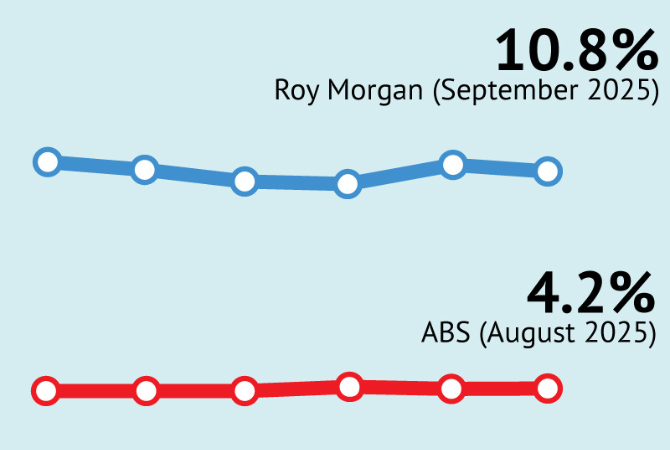
In September Australian unemployment dropped 0.3% to 10.8% and under-employment was down 1.6% to 9.3%
In September 2025, Australian ‘real’ unemployment decreased 37,000 to 1,739,000 (down 0.3% to 10.8% of the workforce) while under-employment dropped 243,000 to 1,499,000 (down 1.6% to 9.3%).
Roy Morgan estimates the overall workforce size (which adds together the employed and unemployed) at just over 16 million in September – 16,058,000 to be exact, up 66,000 on a month ago, and representing 69.4% of Australians aged 14+.
The workforce rise was driven by rising employment, up 103,000 to 14,319,000. The rise in employment was driven by increasing part-time employment, up 105,000 to 5,097,000 while full-time employment was virtually unchanged at 9,222,000. Overall employment represents 61.9% of Australians aged 14+.
Detailed Roy Morgan Employment Estimates in September:
- Australian workforce increased by 66,000 in September to over 16 million:
In September the Australian workforce increased 66,000 to 16,058,000 driven by an increase in employment, up 103,000 to 14,319,000 while unemployment fell by 37,000 to 1,739,000.
- Overall employment increased in September driven by a rise in part-time employment:
Australian employment increased 103,000 to 14,319,000 driven by a rise in part-time employment, up 105,000 to 5,097,000. However, full-time employment was virtually unchanged at 9,222,000.
- Unemployment dropped 0.3% in September to 10.8%:
1,739,000 Australians were unemployed (10.8% of the workforce, down 0.3%), down 37,000 from August. The fall in unemployment was driven by fewer people looking for part-time work, down 57,000 to 1,044,000, although there were more people looking for full-time work, up 20,000 to 695,000.
- Under-employment dropped in September; overall unemployment and under-employed at 20.1%:
In addition to the unemployed, a further 1.5 million Australians (9.3% of the workforce, down 1.6%) were under-employed, i.e. working part-time but looking for more work, down 243,000 from August. In total 3.24 million Australians (20.1% of the workforce) were either unemployed or under-employed in September.
- Comparisons with three years ago, during the early days of the Albanese Government (Sept. 2022), show a rapidly increasing population and workforce driving employment growth:
The Australian population aged 14+ in September 2025 was estimated at 23,140,000 (up 1,766,000 from September 2022 – more than double the pre-pandemic average of 840,000 over a three-year period since 1999). The workforce in September 2025 was 16,058,000 (up 1,151,000 from three years ago) – comprising 14,319,000 employed Australians (up 614,000) and 1,739,000 unemployed Australians (up 537,000).
The September Roy Morgan Unemployment estimates were obtained by surveying an Australia-wide cross section of people aged 14+. A person is classified as unemployed if they are looking for work, no matter when. The ‘real’ unemployment rate is presented as a percentage of the workforce (employed & unemployed).
Roy Morgan Unemployment & Under-employment (2019-2025)
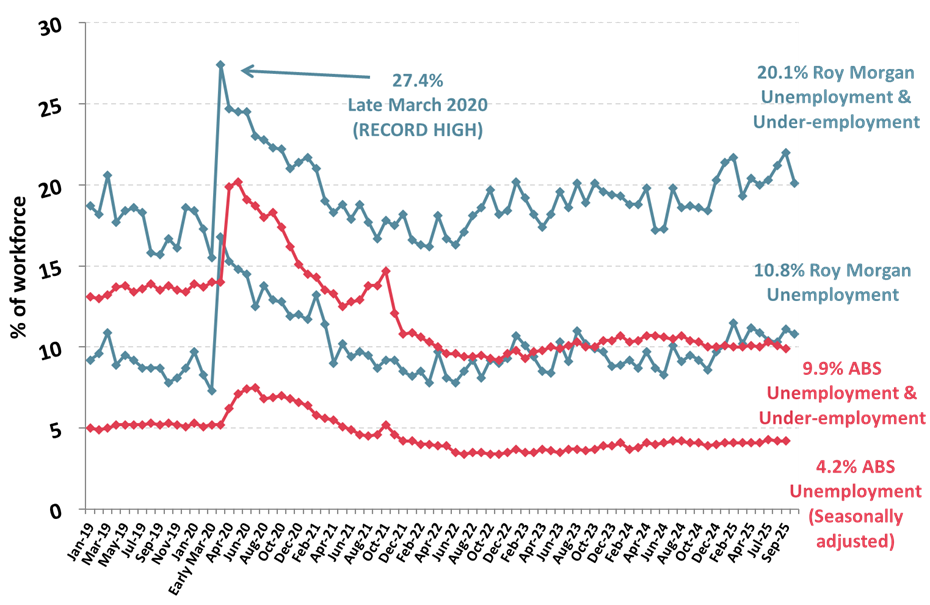
Source: Roy Morgan Single Source January 2019 – September 2025. Average monthly interviews 5,000.
Note: Roy Morgan unemployment estimates are actual data while the ABS estimates are seasonally adjusted.
Michele Levine, CEO Roy Morgan, says the latest Roy Morgan employment estimates for September show both unemployment and under-employment dropping, but the combined figure is still above 3.2 million for a fourth straight month – for the first time since August 2020:

“The latest Roy Morgan employment estimates for September show overall Australian unemployment and under-employment dropping 280,000 to 3,238,000 (20.1% of the workforce, down 1.9%). Although this is a good sign, overall labour under-utilisation remains stuck above 3.2 million for a fourth straight month and has averaged a high 3.3 million so far this year.
“The fall in labour under-utilisation in September was driven by a fall in unemployment, down 37,000 to 1,739,000 (10.8% of the workforce, down 0.3%), and under-employment which fell 243,000 to 1,499,000 (9.3%, down 1.6%) – the first month both indicators have fallen since May 2025.
“The drop in unemployment was driven by a large fall in part-time unemployment which fell by 57,000 to 1,044,000 and correlated to a rise in part-time employment, which increased 105,000 to 5,097,000.
“In September the overall picture shows the movements in the Australian labour market were the most positive since the re-election of the Albanese Government in early May – rising employment (+103,000) and falling labour under-utilisation (-280,000).
“A comparison to a year ago shows the nature of the employment market is shifting with full-time employment down 150,000 from September 2024, but part-time employment increasing 164,000 over the same period – a net growth in overall employment of 14,000.
“This shift is clear when looking at the share of employed Australians in full-time and part-time employment. The share of employed Australians in part-time employment is now 35.6%, up 1.1% points from a year ago, compared to 64.4% now in full-time employment.
“The continuing high level of unemployment and under-employment in the Australian labour force must be a key focus for the newly re-elected Albanese Government as it considers what policies to prioritise over the next few years.”
This Roy Morgan survey on Australia’s unemployment and ‘under-employed’* is based on weekly interviews of 980,365 Australians aged 14 and over between December 2008 and September 2025 and includes 5,876 telephone and online interviews in September 2025. *The ‘under-employed’ are those people who are in part-time work or freelancers who are looking for more work.
Contact Roy Morgan to learn more about Australia’s unemployed and under-employed; who and where they are, and the challenges they face as they search for employment opportunities.
Visit the Roy Morgan Online Store to purchase employment profiles, including for Australians who are employed, unemployed, under-employed, employed part-time, employed full-time, retired, studying and many more.
Margin of Error
The margin of error to be allowed for in any estimate depends mainly on the number of interviews on which it is based. Margin of error gives indications of the likely range within which estimates would be 95% likely to fall, expressed as the number of percentage points above or below the actual estimate. Allowance for design effects (such as stratification and weighting) should be made as appropriate.
| Sample Size | Percentage Estimate |
| 40% – 60% | 25% or 75% | 10% or 90% | 5% or 95% | |
| 1,000 | ±3.0 | ±2.7 | ±1.9 | ±1.3 |
| 5,000 | ±1.4 | ±1.2 | ±0.8 | ±0.6 |
| 7,500 | ±1.1 | ±1.0 | ±0.7 | ±0.5 |
| 10,000 | ±1.0 | ±0.9 | ±0.6 | ±0.4 |
| 20,000 | ±0.7 | ±0.6 | ±0.4 | ±0.3 |
| 50,000 | ±0.4 | ±0.4 | ±0.3 | ±0.2 |


