Temu and Shein still the headline disruptors in 2025

New data from Roy Morgan capturing the annual shopper base of key retailers in Australia reveals that while the mass retailers are stable, the mid-tier department stores and legacy online retailers are under pressure from ultra-cheap retailers Temu and Shein, both of which have delivered outsized growth over the past year.
Established mass retailers Bunnings, Kmart and Big W remain dominant and stable in 2025 with modest growth in the shopper numbers year-on-year (2% for Bunnings, 3% for Kmart and 1% for Big W); while online marketplaces Temu, Shein and Amazon register strong shopper gains.
- Temu had 5 million Australian shoppers in 2025 (up by 700,000 year-on-year, +17% growth);
- Shein had 2.9 million Australian shoppers (up by 600,000 year-on-year, +28% growth);
- Amazon has also gained 500,000 shoppers year-on-year, though a relatively softer growth rate (+6%) compared to Temu and Shein but from a stronger base.
In contrast, legacy online retailers like eBay and Kogan, as well as major department stores Myer and David Jones are losing shoppers as they struggle to compete with value-focused retailers and online marketplaces, reflecting shifting consumer preferences toward lower prices and more convenient shopping experiences.
Temu, Shein and Amazon also increased frequency of visitation, while most other retailers saw their shoppers shopping less.
Number of shoppers, and year-on-year growth in the number of shoppers
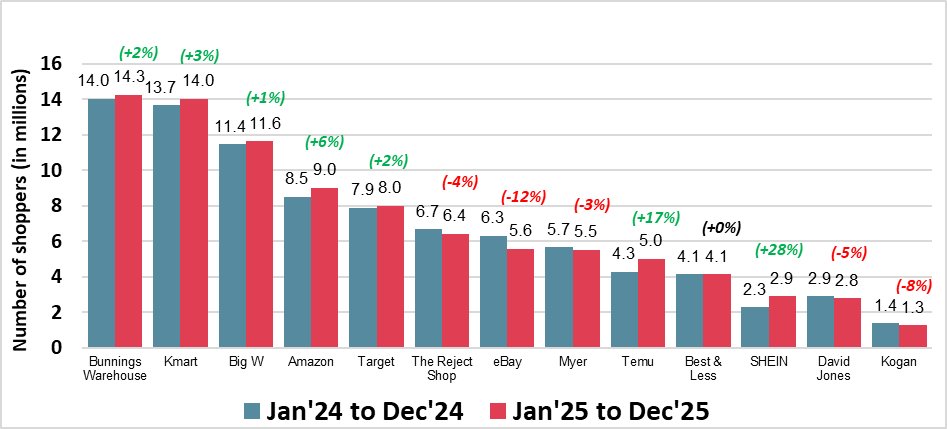
Source: Roy Morgan Single Source, Jan’24 to Dec’25. Base: Australians 14+, n=64,960
Question: ‘In the last 12 months have you bought from...?’
(%) represents year on year growth in the number of shoppers
Roy Morgan estimates that Amazon, Temu, and Shein collectively generated close to $12 billion in retail sales in 2025, reflecting an increase of over $2 billion compared to 2024.
- Amazon is estimated to have achieved nearly $7.1 billion in retail sales in 2025, up from approximately $5.9 billion in 2024, representing an additional $1.2 billion in sales.
- Temu and Shein each reached close to $3 billion and $1.9 billion in sales respectively in 2025, experiencing year-on-year growth of $0.5 billion and $0.4 billion respectively.
Estimated Retail Revenue for 2025 vs. 2024
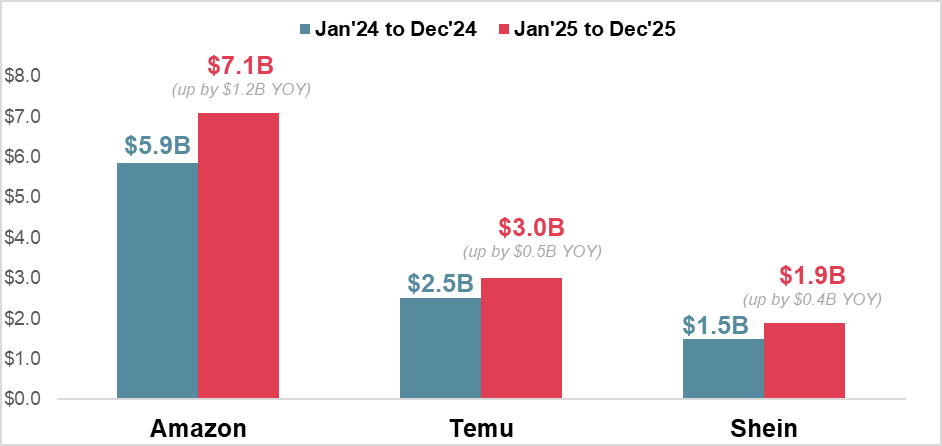
Source: Roy Morgan Single Source, Jan’24 to Dec’25. Base: L4W Shoppers 14+. Amazon n=11,418; Temu n=6,091; Shein n=3,620.
Catherine Jolley, Roy Morgan’s Head of Retail Research and Social & Consumer Trends:

“Ultra-low price positioning from Temu and Shein is resetting consumers’ reference prices. Retailers stuck in the middle – without clear price leadership or strong brand differentiation – face sustained market share loss, margin compression and potential consolidation.
“It is increasingly critical for retailers to either compete decisively on value or clearly differentiate through experience, brand, quality or exclusivity. The ’middle’ of the market is rapidly eroding.”
To learn more about Roy Morgan’s online and shopping data, call (+61) (3) 9224 5309 or email askroymorgan@roymorgan.com. Please click on this link to the Roy Morgan Online Store.
About Roy Morgan
Roy Morgan is Australia’s largest independent Australian research company, with offices in each state, as well as in the U.S. and U.K. A full-service research organisation, Roy Morgan has over 80 years’ experience collecting objective, independent information on consumers.
Margin of Error
The margin of error to be allowed for in any estimate depends mainly on the number of interviews on which it is based. Margin of error gives indications of the likely range within which estimates would be 95% likely to fall, expressed as the number of percentage points above or below the actual estimate. Allowance for design effects (such as stratification and weighting) should be made as appropriate.
| Sample Size | Percentage Estimate |
| 40% – 60% | 25% or 75% | 10% or 90% | 5% or 95% | |
| 1,000 | ±3.0 | ±2.7 | ±1.9 | ±1.3 |
| 5,000 | ±1.4 | ±1.2 | ±0.8 | ±0.6 |
| 7,500 | ±1.1 | ±1.0 | ±0.7 | ±0.5 |
| 10,000 | ±1.0 | ±0.9 | ±0.6 | ±0.4 |
| 20,000 | ±0.7 | ±0.6 | ±0.4 | ±0.3 |
| 50,000 | ±0.4 | ±0.4 | ±0.3 | ±0.2 |