


ALP retains lead, but One Nation builds support after stunning victory in Secret Harbour by-election in Western Australia

This week ALP primary support is down 2.5% to 27%, just ahead of One Nation 26.5% (up 3%), and the L-NP Coalition 21.5% (up 1%) - Liberals 17% (down 1%) and Nationals 4.5% (up 2%), Greens, up 1% to 14.5%, and Independents/ Other Parties down 2.5% to 10.5% according to the Roy Morgan Poll conducted from August 31 – September 6, 2026, with a representative Australia-wide cross-section of 1,541 electors.
One Nation completed a stunning victory in the Secret Harbour by-election a week ago, with One Nation’s primary vote surging by over 30% to 39%, while the ALP vote was down over 20% to just 24%. The large swings led to an easy One Nation victory leading 57%-43% on a two-party preferred basis.
The good publicity for One Nation after the victory has translated into a surge in support for the party which during the previous week had lost support following uncertainty about the party’s immigration policy.
If a Federal Election were held now the ALP would win a majority against either One Nation or the L-NP Coalition
In many electorates at the Election the contest is set to be between the ALP and One Nation. When preferences are allocated for Coalition, Greens, Independent, and Other Party supporters between the ALP and One Nation, Roy Morgan estimates the ALP 53.5% (down 2%) in front of One Nation 46.5% (up 2%).
If the contest is between the ALP and L-NP, on a two-party preferred basis (based on how electors said they’d ’vote’ their preferences), the ALP is also ahead – ALP 53% (down 3%) cf. L-NP 47% (up 3%). However, when preferences are allocated based on how Australians voted at the 2025 Federal Election the gap is closer, ALP 52.5% (down 2.5%) leads L-NP 47.5% (up 2.5%).
The complicated nature of the next Federal Election means there will be contests between the ALP and One Nation, the ALP and L-NP Coalition, One Nation and the L-NP Coalition, and any three of these parties against the Greens, Teal Independents, and other minor parties such as Katter’s Australian Party (KAP).
Roy Morgan will be providing an extensive analysis of the Australia’s 150 Federal Electorates in the next few weeks using the Helix Personas psychographic consumer segmentation and data integration tool which provides unique and incisive insights into the minds of Australian electors.
Large majority of 62% (up 3% points) of electors say Australia is ‘going in the wrong direction’
A large majority of Australians, 62%, say the country is ‘going in the wrong direction’ (up 3%). Only 24% (down 4%) say the country is ‘going in the right direction’.
Analysis by gender shows 62.5% of men and 61.5% of women say Australia is ‘going in the wrong direction’. In contrast, only 24.5% of men and just 23% of women say Australia is ‘going in the right direction’.
Analysis by voting intention shows a majority of One Nation supporters (91%), L-NP Coalition supporters (76%), Other Party supporters (69%), Independent supporters (60%), and Greens supporters (59%) say that the country is ‘going in the wrong direction’.
In contrast, only 26% of ALP supporters say the country is ‘going in the wrong direction’ – a slim majority of 54% say the country is ‘going in the right direction’.
Roy Morgan Interviewing in August & September 2026: Primary Vote & Two-Party Preferred
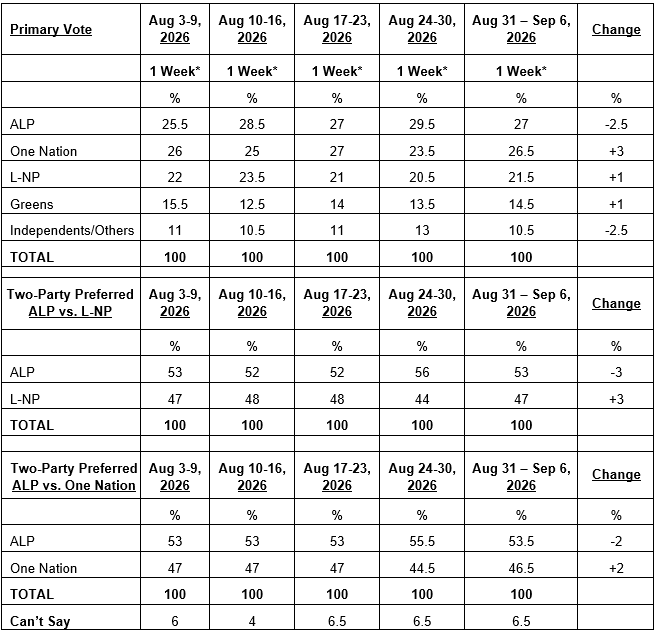
*Interviewing dates of Australian electors aged 18+: Aug. 3-9, 2026 (n=1,647), Aug 10-16, 2026 (n=1,576), Aug 17-23, 2026 (n=1,508), Aug. 24-30, 2026 (n=1,585), Aug. 31-Sept. 6, 2026 (n=1,541). This week 6.5% (unchanged) of those surveyed can’t say who they would vote for.
Further details will be released in Roy Morgan’s weekly video update presented by Roy Morgan Chief Executive Officer Michele Levine.
For detailed analysis such as by States, capital cities/country areas, age, gender, occupation, and education contact Julian McCrann on (03) 9224 5365 or email julian.mccrann@roymorgan.com.
About Roy Morgan
Margin of Error
The margin of error to be allowed for in any estimate depends mainly on the number of interviews on which it is based. Margin of error gives indications of the likely range within which estimates would be 95% likely to fall, expressed as the number of percentage points above or below the actual estimate. Allowance for design effects (such as stratification and weighting) should be made as appropriate.
| Sample Size | Percentage Estimate |
| 40% – 60% | 25% or 75% | 10% or 90% | 5% or 95% | |
| 1,000 | ±3.0 | ±2.7 | ±1.9 | ±1.3 |
| 5,000 | ±1.4 | ±1.2 | ±0.8 | ±0.6 |
| 7,500 | ±1.1 | ±1.0 | ±0.7 | ±0.5 |
| 10,000 | ±1.0 | ±0.9 | ±0.6 | ±0.4 |
| 20,000 | ±0.7 | ±0.6 | ±0.4 | ±0.3 |
| 50,000 | ±0.4 | ±0.4 | ±0.3 | ±0.2 |


