


One Nation support is strongest among electors born in South Africa and Italy and weakest among electors born in Asia

New Roy Morgan analysis into the voting intentions of electors by country/region of birth shows Australian electors born in South Africa (36% supporting One Nation), Italy (30%), and Mainland Europe as a whole (29%) are significantly more likely to vote for One Nation than the average elector (24%) according to interviewing conducted with a representative cross-section of 26,418 electors during the first seven months of 2026.
In contrast, electors born in Mainland China (5% support One Nation), Nepal (6%), Pakistan, Vietnam and Sri Lanka (all 7%), India (8%), United States and Canada (9%), Asia (9%), Malaysia (10%), Africa – not including South Africa (11%) and Central and South America (12%), Philippines (16%), and the Middle East (17%) are all far less likely to vote for One Nation than the average Australian.
Voters born in Australia (25% support One Nation), the United Kingdom (23%) and New Zealand (24%) were not significantly different to the average elector (24%) when it came to how likely they were to support One Nation.
One Nation voting intention by country/region of birth
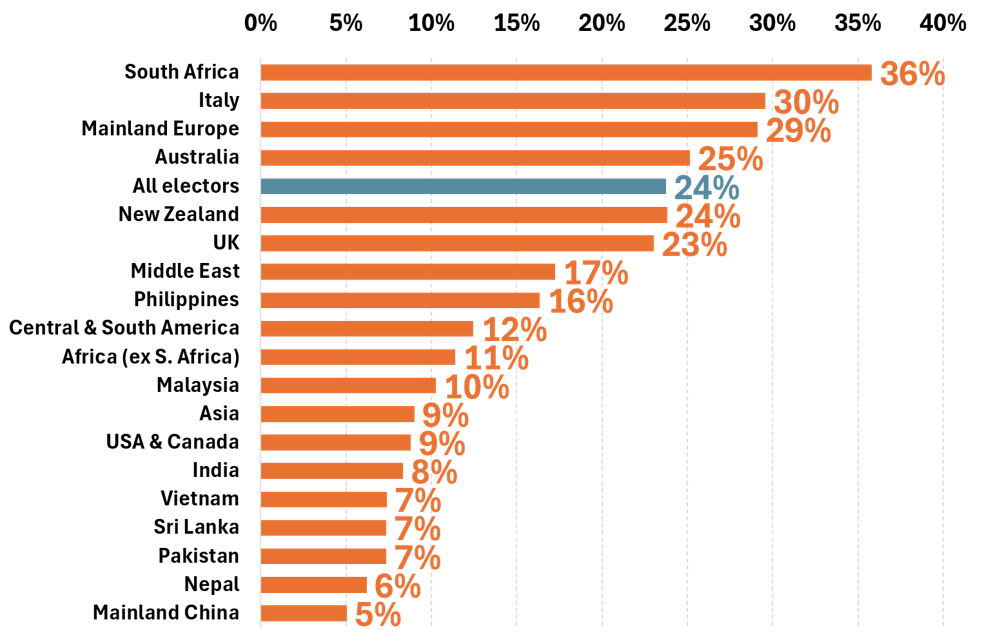
Source: Roy Morgan Single Source (Australia). Base: Australian electors aged 18+ between January 2026 and July 2026) (n=26,418).
Asian-born electors are more likely to vote for the traditional major parties than the average elector
Asian-born electors favour the traditional ‘major parties’ (the ALP and L-NP Coalition) at the expense of One Nation, although there are other interesting differences for electors born in different countries.
Among Asian-born electors, support for Labor is highest for those born in Vietnam (57% support Labor), Nepal (52%), Sri Lanka (49%), Mainland China (46%), Pakistan (46%), Malaysia (44%), and India (43%), and lowest in the Philippines (38%) – though support in all eight countries is higher for Labor than the average elector at 34%.
Support for the Greens is clearly highest among Pakistan-born Australians at 32% - more than double the support the party gets from any of the other major immigrant groups. This is likely due to prominent Greens Senator Mehreen Faruqi, the first Pakistan-born Australian elected to Federal Parliament.
Support for the L-NP Coalition is highest among immigrants from Mainland China (34%), India (33%), Nepal (30%), Philippines (30%), Vietnam (29%), Malaysia (29%), and Sri Lanka (27%), and lowest among immigrants from Pakistan (12%), Italy (18%), and the United Kingdom (19%).
For all electors during the first seven months of 2026, 34% supported Labor, 24% supported One Nation, 22% supported the L-NP Coalition, 13% supported the Greens, and 7% supported Independents and Other Parties.
Voting intention by country of birth (All Electors, Australia & Top 5 Immigrant Nations)
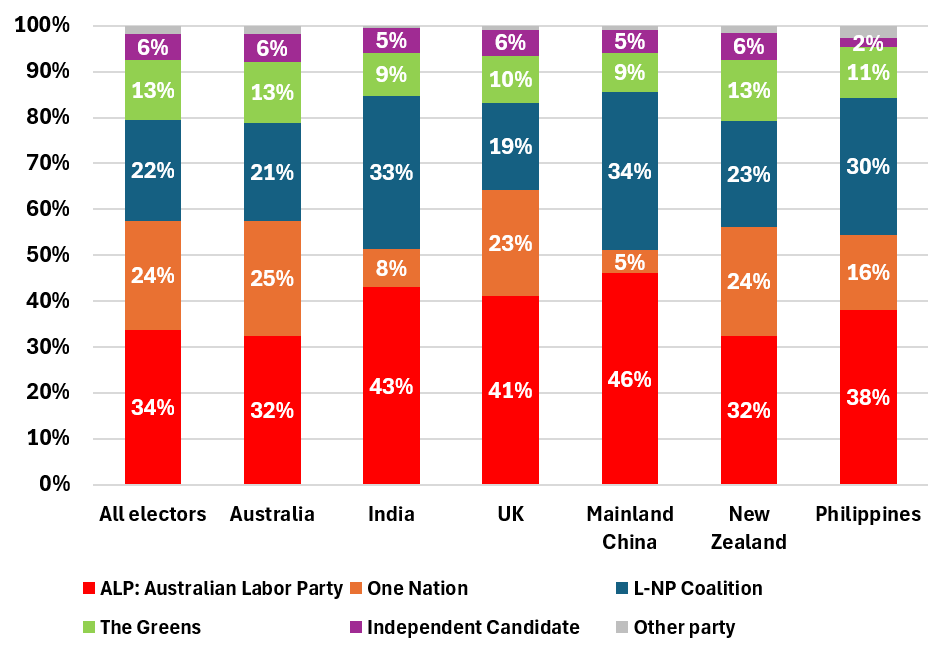
Source: Roy Morgan Single Source (Australia). Base: Australian electors aged 18+ between January 2026 and July 2026) (n=26,418). Born in: Australia (n=21,147), India (n=407), UK (n=1423), Mainland China (n=198), New Zealand (n=447), Philippines (n=186).
Born in: Australia (n=21,147), India (n=407), UK (n=1423), Mainland China (n=198), New Zealand (n=447), Philippines (n=186), Vietnam (n=96), South Africa (n=242), Nepal (n=49), Sri Lanka (n=105), Malaysia (n=98), Italy (n=82), Pakistan (n=71).
Voting intention by country of birth (All Electors, Australia & 6-12th ranked Immigrant Nations)
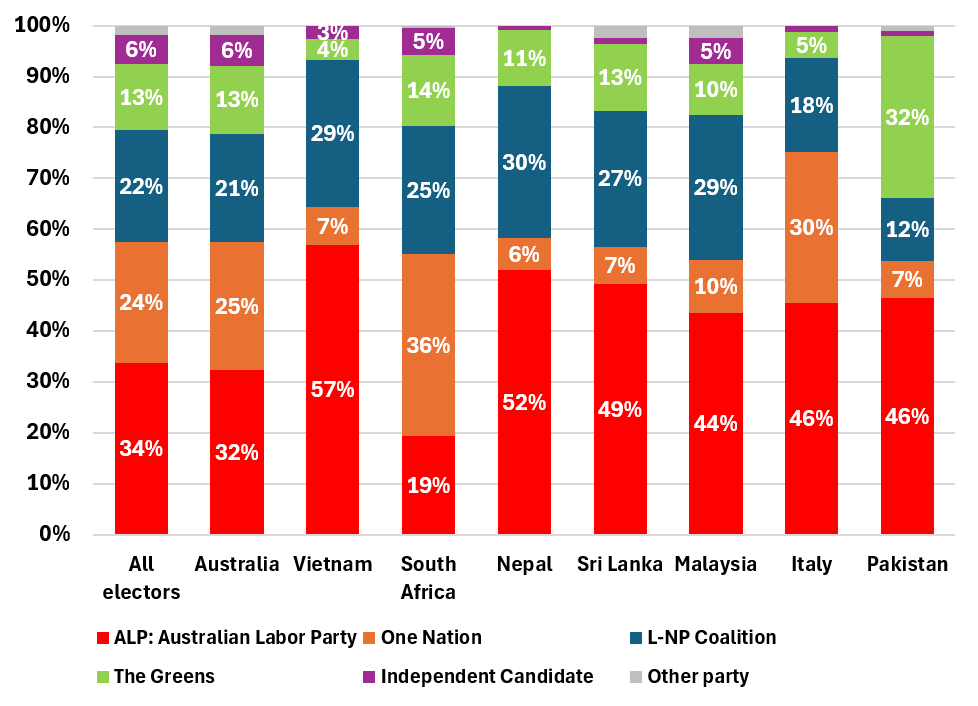
Source: Roy Morgan Single Source (Australia). Base: Australian electors aged 18+ between January 2026 and July 2026) (n=26,418). Born in: Australia (n=21,147), Vietnam (n=96), South Africa (n=242), Nepal (n=49), Sri Lanka (n=105), Malaysia (n=98), Italy (n=82), Pakistan (n=71).
Roy Morgan CEO Michele Levine says the voting trends of immigrants to Australia differ widely depending on the country an immigrant was born in, and the differences in support for One Nation are the clearest indicator of this:

“A special Roy Morgan analysis of voting trends by ‘Country of Birth’ reveals stark differences between how immigrants from different countries vote – especially as it relates to the rising political force represented by One Nation.
“During the first seven months of this year around a quarter of all electors (24%) said they would support One Nation – almost identical to the result for Australian-born electors (25%).
“However, immigrants from South Africa (36% support One Nation) and Italy (30%) are far more likely to vote for One Nation than the average elector. Support for One Nation is also much higher than average among the smaller immigrant cohorts from Greece and Israel – neither of which is among the top 20 immigrant nations to Australia.
“There is a huge contrast to electors born in Asia and North America. Support for One Nation is less than half the national average among key immigrant communities from Mainland China (5% support One Nation) and India (8%). In addition, support for One Nation is low amongst other immigrant communities from Nepal (6%), Vietnam, Sri Lanka & Pakistan (all 7%), the United States and Canada (9%), Asia (9%), Malaysia (10%), and Africa – not including South Africa (11%).
“Immigrants from Asian countries tend to have far higher support for the traditional major parties of Labor and the L-NP Coalition. Support for Labor is above 40% for immigrants from Mainland China, India, Vietnam, Nepal, Sri Lanka, Malaysia and Pakistan.
“Voting sentiment among the large immigrant communities from New Zealand (24% support One Nation) and the United Kingdom (23%) is in line with the overall electorate.
“The different voting intentions of electors depending upon where they are born is an important element for political parties to consider as we approach key State Elections in Victoria (November 2026), New South Wales (March 2027), and a Federal Election due to be held by September 2028.”
For comments or more information about Roy Morgan’s data please contact Julian McCrann for more details.
Email: julian.mccrann@roymorgan.com.
Reports available for sale:
The latest Roy Morgan data is available on the Roy Morgan Online Store. It provides demographic breakdowns for Age, Sex, State, Region (Capital Cities/ Country), Generations, Lifecycle, Socio-Economic Scale, Work Status, Occupation, Home Ownership, Voting Intention, Roy Morgan Value Segments, Helix Personas, Media Consumption, and more.
About Roy Morgan
Roy Morgan is Australia’s largest independent Australian research company, with offices in each state, as well as in the U.S. and U.K. A full-service research organisation, Roy Morgan has over 80 years’ experience collecting objective, independent information on consumers.
Margin of Error
The margin of error to be allowed for in any estimate depends mainly on the number of interviews on which it is based. Margin of error gives indications of the likely range within which estimates would be 95% likely to fall, expressed as the number of percentage points above or below the actual estimate. Allowance for design effects (such as stratification and weighting) should be made as appropriate.
| Sample Size | Percentage Estimate |
| 40% – 60% | 25% or 75% | 10% or 90% | 5% or 95% | |
| 1,000 | ±3.0 | ±2.7 | ±1.9 | ±1.3 |
| 5,000 | ±1.4 | ±1.2 | ±0.8 | ±0.6 |
| 7,500 | ±1.1 | ±1.0 | ±0.7 | ±0.5 |
| 10,000 | ±1.0 | ±0.9 | ±0.6 | ±0.4 |
| 20,000 | ±0.7 | ±0.6 | ±0.4 | ±0.3 |
| 50,000 | ±0.4 | ±0.4 | ±0.3 | ±0.2 |


