


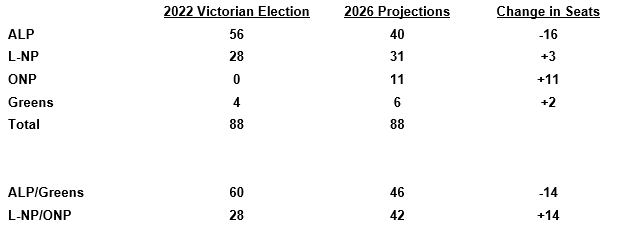
Victorian Election is ‘too close to call’ today: ALP/Greens (46 seats) narrowly ahead of L-NP/ONP (42 seats); One Nation set to win over 10 seats in Lower House

Before all candidates are locked in, before preference deals are done, and before the campaign begins in earnest in the next few weeks Roy Morgan has created a Winnability Score. It combines current State voting intention with how closely an electorate's voter profile aligns with each party's core support base. In other words, it measures not only who is currently voting for a party, but also which voters are most likely to be persuaded to support that party.
This becomes particularly important when assessing the electoral prospects of individual seats and will be updated as new information becomes available.
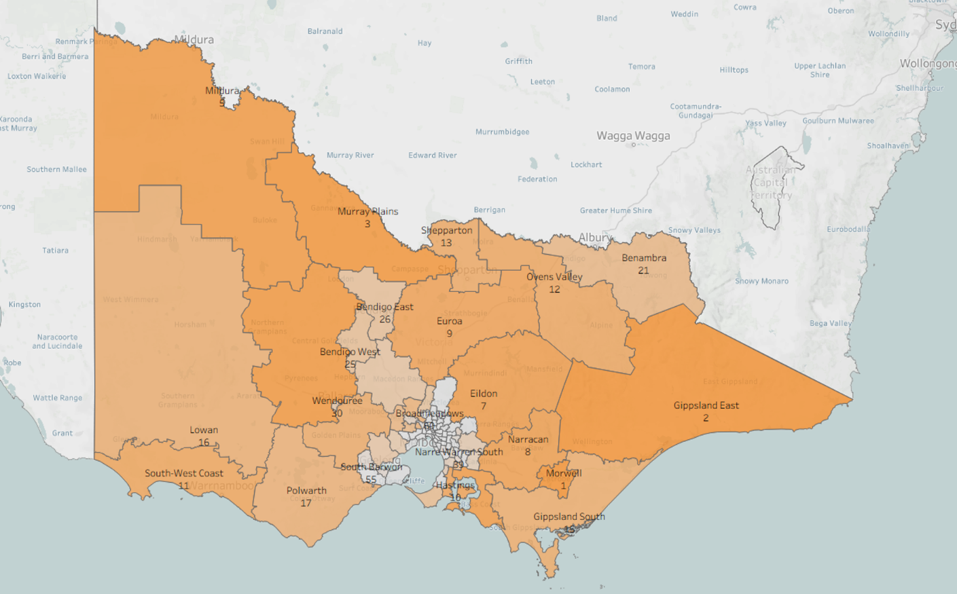
For example, this map illustrates One Nation's Winnability Score across Victoria by electorate. Electorates shown in dark orange are considered the most winnable for One Nation, while those shaded gray represent the party's least favourable opportunities.
88 Victorian Elections ranked by One Nation ‘winnability’ - Victoria
Source: Roy Morgan Single Source. March 2026 – September 2026. Base: Victorian electors aged 18+, n=7,708.
Unsurprisingly, the strongest concentrations of winnable seats are found across regional and rural Victoria, where the electorate profiles align more closely with the voter segments that have shown growing support for One Nation.
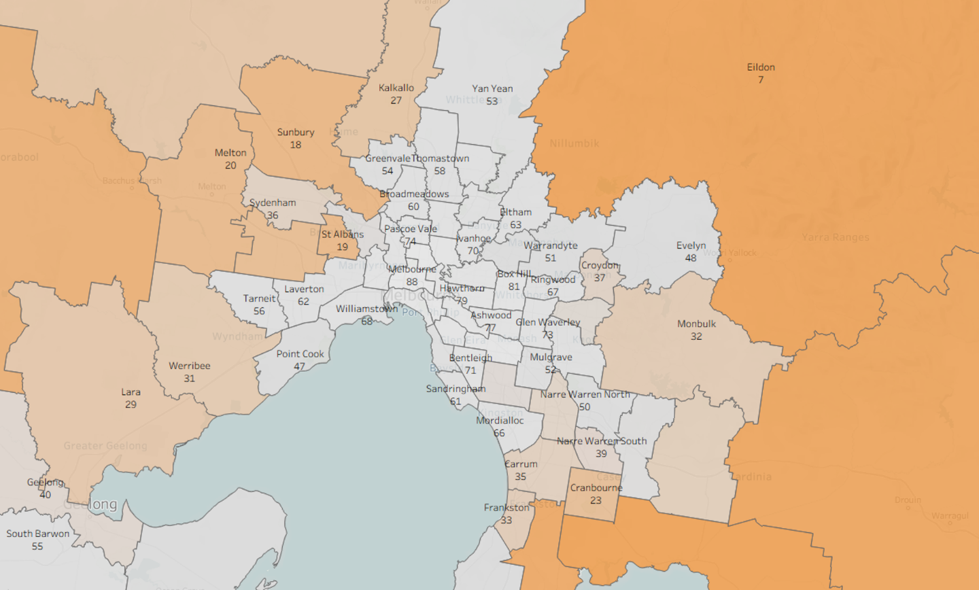
But the map also highlights that One Nation's appeal is no longer limited to traditional rural strongholds. A number of outer metropolitan and regional growth areas also display relatively high Winnability Scores, reflecting the party's increasing support across a broader range of voter segments.
88 Victorian Elections ranked by One Nation ‘winnability’ – Metropolitan Melbourne
Source: Roy Morgan Single Source. March 2026 – September 2026. Base: Victorian electors aged 18+, n=7,708.
Overall, the map demonstrates that although One Nation's greatest opportunities remain in regional Victoria, its electoral potential now extends well beyond the stereotypical "country voter" base, giving the party a competitive presence across a much wider part of the State.
In contrast, many inner-city and metropolitan electorates rank much lower on the Winnability Index. These areas are typically ‘Metrotech’ in nature, people who are more likely to support the Labor Party or the Greens, with pockets of strength for the Liberal Party in the inner east and inner south.
But key questions remain about the Victorian Election:
- What will happen in the next few weeks?
- How will preferences flow, will there be coalitions formed or will parties go it alone and potentially result in a minority government,
- Or will One Nation be underestimated, like the Democratic Labor Party (DLP) in the 1950s, Donald Trump in 2016 or even the recent Brazilian Presidential Election in which right wing candidate Flavio Bolsonaro was underestimated in polling by around 7 percentage points, but eventually won the first round 47% cf. 45% President Luiz Inácio Lula da Silva.
Of particular importance to the result in this year’s Victorian Election, is the final primary vote on a seat-by-seat basis as well as the preference deals, and more importantly preference flows, in each seat.
Because preference flows can change dramatically depending on the order of parties eliminated in each seat, the overall winnability score in any given seat can be impacted by the final primary vote result and the given preference flows in that seat.
Overall Victorian Election result hangs in the balance with ALP/Greens (46) just ahead of L-NP/ONP (42)
If a Victorian election were held today, based on a seat-by-seat analysis of Roy Morgan data from the past six months, with preferences allocated based on how electors said they would vote. It would be a real cliffhanger.
Two natural coalitions – that we’re told won’t happen – would see a Labor Greens government with 46 seats just ahead of a competitive L-NP/One Nation (ONP) opposition on 42 seats.
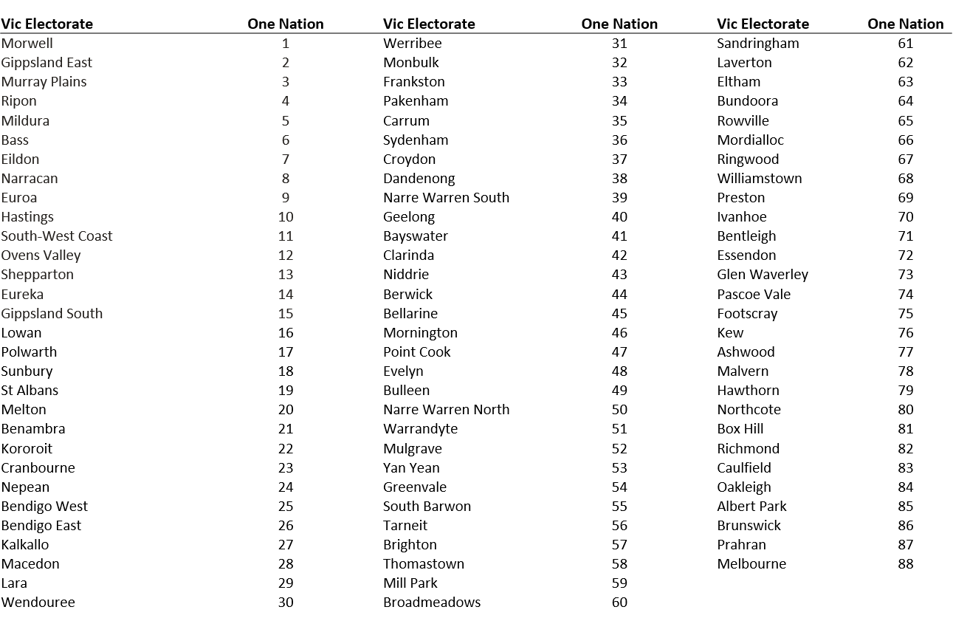
See below for a full list of all 88 Victorian Electorates ranked on One Nation’s winnability score.
Overall Victorian Election Result on Current Projections
Source: Roy Morgan Single Source. March 2026 – September 2026. Base: Victorian electors aged 18+, n=7,708.
Further details are available in Roy Morgan’s weekly video update presented by Roy Morgan Chief Executive Officer Michele Levine.
In-depth detailed analysis such as by capital cities/country areas, age, gender, Victoria’s eight Upper House regions, occupation, and education is available to subscribers to the Morgan Poll.
To learn more contact Julian McCrann on (03) 9224 5365 or email julian.mccrann@roymorgan.com.
About Roy Morgan
Roy Morgan is Australia’s largest independent Australian research company, with offices in each state, as well as in the U.S. and U.K. A full-service research organisation, Roy Morgan has over 80 years’ experience collecting objective, independent information on consumers.
Appendix 1: 88 Victorian Elections ranked by One Nation ‘winnability’ – Full List
Source: Roy Morgan Single Source. March 2026 – September 2026. Base: Victorian electors aged 18+, n=7,708.
Margin of Error
The margin of error to be allowed for in any estimate depends mainly on the number of interviews on which it is based. Margin of error gives indications of the likely range within which estimates would be 95% likely to fall, expressed as the number of percentage points above or below the actual estimate. Allowance for design effects (such as stratification and weighting) should be made as appropriate.
| Sample Size | Percentage Estimate |
| 40% – 60% | 25% or 75% | 10% or 90% | 5% or 95% | |
| 1,000 | ±3.0 | ±2.7 | ±1.9 | ±1.3 |
| 5,000 | ±1.4 | ±1.2 | ±0.8 | ±0.6 |
| 7,500 | ±1.1 | ±1.0 | ±0.7 | ±0.5 |
| 10,000 | ±1.0 | ±0.9 | ±0.6 | ±0.4 |
| 20,000 | ±0.7 | ±0.6 | ±0.4 | ±0.3 |
| 50,000 | ±0.4 | ±0.4 | ±0.3 | ±0.2 |


