


ALP continues to hold an election winning lead; One Nation is highest in Western Australia and Queensland, Labor is strongest in New South Wales and South Australia

Over the past fortnight the ALP maintains an election winning lead with 26% (unchanged from two weeks ago) of the primary vote, ahead of One Nation on 24% (down 1.5%). The L-NP Coalition primary is 21.5% (down 1%): (18.5% Liberal, 3% Nationals); Greens 15% (unchanged) and Independent/Others 13.5% (up 2.5%).
This result comes in a fortnight in which the Coalition finally announced their immigration policies involving a significant cut to immigration, the Reserve Bank raised interest rates for the fourth time this year by +0.25% to a 15-year high of 4.6%, and the latest ABS official CPI was recorded at a high of 4% for the year to August.
These results are according to the Roy Morgan Poll conducted from September 28 – October 11, 2026, with a representative Australia-wide cross-section of 2,655 electors.
If a Federal Election were held now the ALP would win a majority against either One Nation or the L-NP Coalition
In many electorates at the Election the contest is set to be between the ALP and One Nation. When preferences are allocated for Coalition, Greens, Independent, and Other Party supporters between the ALP and One Nation, Roy Morgan estimates the ALP 54.5% (up 1%) in front of One Nation 45.5% (down 1%).
If the contest is between the ALP and L-NP, on a two-party preferred basis (based on how electors said they’d ’vote’ their preferences), the ALP is also ahead – ALP 53% (up 0.5%) cf. L-NP 47% (down 0.5%). However, when preferences are allocated based on how Australians voted at the 2025 Federal Election the gap is closer, ALP 53.5% (up 1.5%) leads L-NP 46.5% (down 1.5%).
The complicated nature of the next Federal Election means there will be contests between the ALP and One Nation, the ALP and L-NP Coalition, One Nation and the L-NP Coalition, and any three of these parties against the Greens, Teal Independents, and other minor parties such as Katter’s Australian Party (KAP).
Roy Morgan will be providing an extensive analysis of the Australia’s 150 Federal Electorates in the next few weeks using the Helix Personas psychographic consumer segmentation and data integration tool which provides unique and incisive insights into the minds of Australian electors.
One Nation’s vote is highest in Western Australia (29.5%) and Queensland (28%) and lowest in South Australia (14.5%)
Among the five mainland states, One Nation records its highest vote in Western Australia (29.5%) and Queensland (28%) and lowest vote in South Australia (14.5%) – the State with the most elected One Nation MPs (seven – four in the SA Legislative Assembly and three in the SA Legislative Council).
Importantly, support for One Nation in Victoria was down 4% from a fortnight ago to 19% - despite the party’s heavily covered State Election launch held on Saturday October 6 at Melbourne’s Crown Casino held during the middle of the interviewing period. The results from this Roy Morgan Poll suggest there was no ‘poll bounce’ for the party nationally following the Victorian launch.
In contrast, Labor is strongest in South Australia (28%) and New South Wales (27.5%) – two States with strong Labor Governments, and weakest in Western Australia (22%). The L-NP Coalition polls best in Victoria (27%) – and facing a key State Election next month, and South Australia (24%), while the Greens’ best States are South Australia (20.5%) and Victoria (16.5%) and their worst state is Western Australia (12%).
Large majority of 62.5% of electors say Australia is ‘going in the wrong direction’
A large majority of Australians, 62.5% (down 1% from a fortnight ago), say the country is ‘going in the wrong direction’. Only 24.5% (up 3%) say the country is ‘going in the right direction’.
Analysis by state shows a majority in all states believe the country is going in the wrong direction. This is highest in Queensland, where 68.5% believe this, and once again lowest in South Australia (54%).
Roy Morgan Interviewing 28 September – 11 October 2026: Primary Vote by City/Country
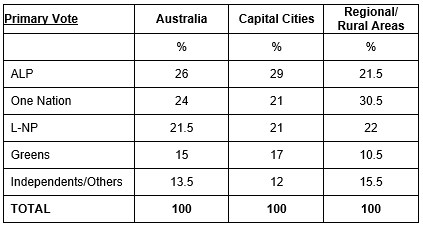
Interviewing dates of Australian electors aged 18+: Sep. 28 – Oct 11, 2026 (n=2,655). Capital Cities (n=1,706), Country Regions (n=949). This fortnight 7% (unchanged) of those surveyed can’t say who they would vote for.
Roy Morgan Interviewing 14-27 September 2026: Primary Vote by City/Country
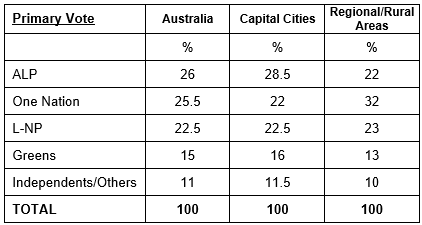
Interviewing dates of Australian electors aged 18+: Sep. 14-27, 2026 (n=2,569). Capital Cities (n=1,638),
Country Regions (n=931). This fortnight 7% (unchanged) of those surveyed can’t say who they would vote for.
Roy Morgan Interviewing 28 September – 11 October 2026: Primary Vote by State
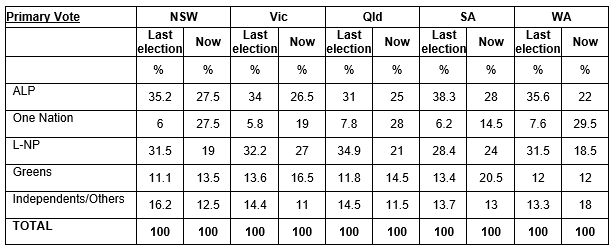
Interviewing dates of Australian electors aged 18+: Sep. 28 – Oct 11, 2026 (n=2,655), NSW (n=780), Vic (n=730), Qld (n=471), SA (n=241), WA (n=235). This fortnight 7% (unchanged) of those surveyed can’t say who they would vote for.
Roy Morgan Interviewing 14-27 September 2026: Primary Vote by State
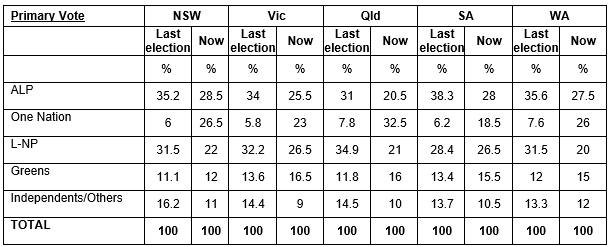
Interviewing dates of Australian electors aged 18+: Sep. 14-27, 2026 (n=2,569), NSW (n=765), Vic (n=626), Qld (n=506), SA (n=228), WA (n=235). This fortnight 7% of those surveyed can’t say who they would vote for.
Roy Morgan Interviewing 14 September – 11 October 2026: Primary Vote for Tasmania
| Primary Vote | Tasmania | |
| Last election | Now | |
| % | % | |
| ALP | 36.6 | 27.5 |
| One Nation | 6.0 | 23 |
| L-NP | 24.5 | 14 |
| Greens | 11.1 | 17.5 |
| Independents/Others | 21.8 | 18 |
| TOTAL | 100 | 100 |
Interviewing dates of Tasmanian electors aged 18+: Sep. 14 – Oct 11, 2026 (n=204).
Roy Morgan Interviewing in August, September & October 2026: Primary Vote & Two-Party Preferred
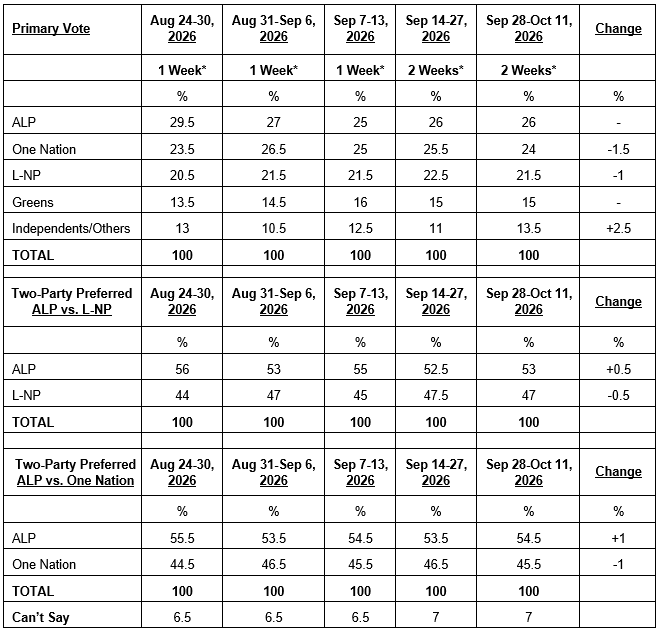
*Interviewing dates of Australian electors aged 18+: Aug. 24-30, 2026 (n=1,585), Aug. 31-Sept. 6, 2026 (n=1,541), Sep 7-13, 2026 (n=1,583). Sep 14-27, 2026 (n=2,569), Sep. 28 – Oct 11, 2026 (n=2,655). This week 7% (unchanged) of those surveyed can’t say who they would vote for.
Further details will be released in Roy Morgan’s weekly video update presented by Roy Morgan Chief Executive Officer Michele Levine.
For detailed analysis such as by States, capital cities/country areas, age, gender, occupation, and education contact Julian McCrann on (03) 9224 5365 or email julian.mccrann@roymorgan.com.
About Roy Morgan
Margin of Error
The margin of error to be allowed for in any estimate depends mainly on the number of interviews on which it is based. Margin of error gives indications of the likely range within which estimates would be 95% likely to fall, expressed as the number of percentage points above or below the actual estimate. Allowance for design effects (such as stratification and weighting) should be made as appropriate.
| Sample Size | Percentage Estimate |
| 40% – 60% | 25% or 75% | 10% or 90% | 5% or 95% | |
| 1,000 | ±3.0 | ±2.7 | ±1.9 | ±1.3 |
| 5,000 | ±1.4 | ±1.2 | ±0.8 | ±0.6 |
| 7,500 | ±1.1 | ±1.0 | ±0.7 | ±0.5 |
| 10,000 | ±1.0 | ±0.9 | ±0.6 | ±0.4 |
| 20,000 | ±0.7 | ±0.6 | ±0.4 | ±0.3 |
| 50,000 | ±0.4 | ±0.4 | ±0.3 | ±0.2 |


