ANZ-Roy Morgan Inflation Expectations up slightly to 4.9% in late July – up from 4.8% for the month of June

The weekly ANZ-Roy Morgan Inflation Expectations were 4.9% for the week of July 21-27, 2025, up 0.1% points from the month of June, but down from the peak of 5% in early July.
A look at monthly Inflation Expectations for June 2025 shows the measure at 4.8% for the month – an increase of 0.2% points from May and level with the average so far this year – also of 4.8%.
Looking back over the last year, weekly Inflation Expectations have moved in a band of 4.2% - 5.2% since the start of June 2024 and averaged 4.8%. In addition, the latest information on weekly Inflation Expectations is available to view each week in the Roy Morgan Weekly Update video on YouTube.
Monthly Inflation Expectations Index long-term trend – Expected Annual Inflation in next 2 years
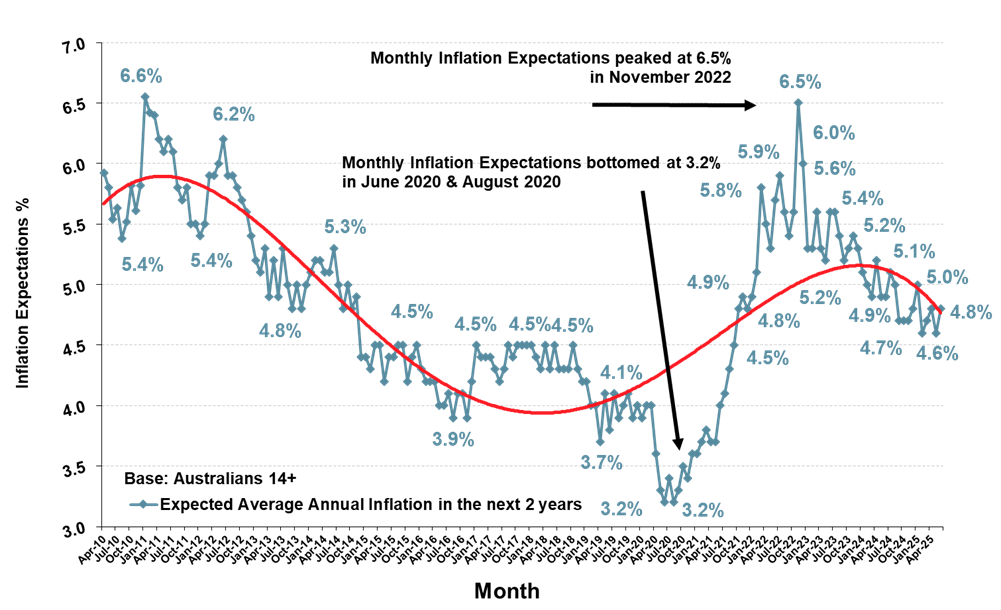
Source: Roy Morgan Single Source: Interviewing an average of 5,000 Australians aged 14+ per month (April 2010 – June 2025).
Average retail petrol prices increased to $1.78 per litre in June; the biggest monthly increase this year
During June, average retail petrol prices increased by five cents per litre to $1.78 per litre – this was the largest monthly increase in average retail petrol prices since April 2024. Average retail petrol prices started the month at $1.76 per litre and increased to $1.79 for the final week of June.
After June ended, average retail petrol prices spiked in early July and jumped up as high as $1.86 per litre in mid-July, the highest prices have been for five months since February 2025. However, since then, prices have again declined over the last few weeks since mid-July.
Average retail petrol prices hit near three-year lows in May but then rebounded – and this volatility is reflected in the weekly Inflation Expectations of Australians which have moved in a band of 0.5% between 4.5-5% during May, June and so far in July. On a weekly level, Inflation Expectations have increased five times, decreased six times, and been unchanged for two weeks during this period.
Looking longer-term, average retail petrol prices have now been at, or above, $1.70 per litre for a record 149 straight weeks since mid-September 2022 – for almost three years. In mid-July average retail petrol prices hit a high of $1.86 per litre – the highest level for over four months since late February.
Looking back average retail petrol prices have now averaged $1.86 per litre since late February 2024, but this has dropped to an average of $1.78 per litre since mid-March 2025 over the last 20 weeks. The reduction in petrol prices this year has clearly lessened inflation pressures and was no doubt a key factor for the Reserve Bank behind its decision to cut interest rates in February and again in late May.
Australian average retail petrol prices (cents per litre) weekly: 2021 – 2025
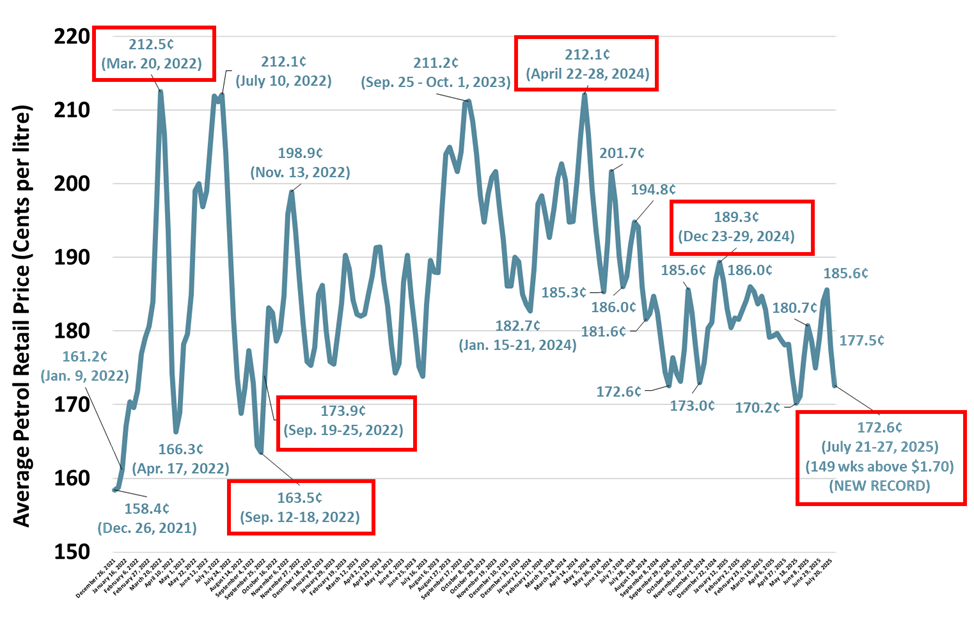
Source: Australian Institute of Petroleum (AIP) weekly reports: https://www.aip.com.au/pricing/weekly-prices-reports.
The latest official ABS Monthly annual CPI estimate at 2.1% for the year to May 2025 is directly within the Reserve Bank’s preferred target range of 2-3% over the course of the economic cycle. Official estimates of inflation have now been within the preferred target range for ten months since August 2024.
The drop in official estimates of inflation led to the first cut in official interest rates for over four years since the middle of the COVID-19 pandemic by the RBA in mid-February by +0.25% to 4.1% and there are widespread expectations the RBA will make an additional cut to interest rates again in early August.
The next ABS Monthly CPI estimate for June 2025 is due to be released this week on Wednesday.
Inflation Expectations were highest in Western Australia and Queensland at 5% or more in June
A look at Monthly Inflation Expectations on a State-based level for June shows mixed results with increases in New South Wales, Victoria and Western Australia driving the overall increase.
The major increase was in Western Australia, up 0.7% points to 5.5% and is now clearly the highest Inflation Expectations of any State. Despite a fall of 0.2% points, Inflation Expectations remain second highest in Queensland at 5.0%.
There were also significant increases in New South Wales, up 0.5% points to 4.9%, and Victoria, up 0.3% points to 4.9%. Inflation Expectations are above the national average in all four of the largest States.
Inflation Expectations fell in the two smallest States of Tasmania, down 0.4% points to 4.3%, and also fell in South Australia, down 0.3% points to 4.2% and now the lowest Inflation Expectations of any State.
Inflation Expectations in Country Areas increased 0.2% points to 5.1% in June and were up 0.2% points to 4.7% in Capital Cities – a similar increase in the two differing regions.
Roy Morgan CEO Michele Levine says weekly Inflation Expectations were at 4.9% in late July, up 0.1% points from the June estimate of 4.8%, after petrol prices jumped in the first half of July following the ’12 Day War’ between Israel and Iran:

“ANZ-Roy Morgan Inflation Expectations in Australia have increased in July and are now at 4.9%, up 0.1% points from the month of June (4.8%). Inflation Expectations increased in the month of June by 0.2% points from May and the indications are that the monthly level of Inflation Expectations has increased for a second straight month in July.
“Inflation Expectations have spiked in July following the brief ’12 Day War’ between Israel and Iran in late June and early July. The conflict led to an immediate spike in average petrol prices and Inflation Expectations.
“The apparent resolution of the conflict between Israel and Iran led to an immediate drop in petrol prices at the pump by eight cents per litre in mid-July, dropping from $1.86 to $1.78 per litre, but Inflation Expectations remain elevated in July compared to before the conflict broke out.
“The good news for Australians is that the official ABS inflation estimates have continued within the Reserve Bank’s preferred target range of 2-3% over the course of the economic cycle – at 2.1% for the year to May 2025. Inflation Expectations have now been within the target range for ten straight months since August 2024 averaging 2.4% during this period.
“Looking forward, the Reserve Bank is expected to lower interest rates in two weeks’ time in early August, likely by +0.25% to 3.6%, and next meets in late September. By that time the latest June Quarterly Inflation figures (July 30, 2025) will have been released for the board to consider.
“The sharp reduction in inflationary pressures in the broader economy during which official annual inflation fell from 4.1% in 2023 to 2.4% in 2024 – a fall of 1.7% points – led to the Reserve Bank cutting official interest rates in mid-February and mid-May by a total of 0.5% to 3.85%.
“The volatility in energy prices, and Inflation Expectations, in recent weeks and months shows just how sensitive Australians are to changes in the prices of essential everyday goods – like petrol.”
See below for a comprehensive list of RBA interest rate changes during the time-period charted above.
The data for the Inflation Expectations series is drawn from the Roy Morgan Single Source which has interviewed an average of around 5,300 Australians aged 14+ per month over the last decade from July 2015 – June 2025 and includes interviews with 4,051 Australians aged 14+ in June 2025.
For comments and information about Roy Morgan’s Inflation Expectations data, please contact:
Roy Morgan Enquiries
Office: +61 (3) 9224 5309
askroymorgan@roymorgan.com
About Roy Morgan
Roy Morgan is Australia’s largest independent Australian research company, with offices in each state, as well as in the U.S. and U.K. A full-service research organisation, Roy Morgan has over 80 years’ experience collecting objective, independent information on consumers.
The questions used to calculate the Monthly Roy Morgan Inflation Expectations Index.
1) Prices: “During the next 2 years, do you think that prices in general will go up, or go down, or stay where they are now?”
2a) If stay where they are now: “Do you mean that prices will go up at the same rate as now or that prices in general will not go up during the next 2 years?
2b) If go up or go down: “By about what per cent per year do you expect prices to (go up/ go down) on average during the next 2 years?”
3) “Would that be (x%) per year, or is that the total for prices over the next 2 years?”
The Roy Morgan Inflation Expectations Index is a forward-looking indicator unlike the Consumer Price Index (CPI) and is based on continuous (weekly) measurement, and monthly reporting. The Roy Morgan Inflation Expectations Index is current and relevant.
| Monthly Roy Morgan Inflation Expectations Index (2010 – 2025) | |||||||||||||
| Year | Jan | Feb | Mar | Apr | May | Jun | Jul | Aug | Sep | Oct | Nov | Dec | Yearly Average |
| 2010 | n/a | n/a | n/a | 5.9 | 5.8 | 5.5 | 5.6 | 5.4 | 5.5 | 5.8 | 5.6 | 5.8 | 5.7 |
| 2011 | 6.6 | 6.4 | 6.4 | 6.2 | 6.1 | 6.2 | 6.1 | 5.8 | 5.7 | 5.8 | 5.5 | 5.5 | 6.0 |
| 2012 | 5.4 | 5.5 | 5.9 | 5.9 | 6.0 | 6.2 | 5.9 | 5.9 | 5.8 | 5.7 | 5.6 | 5.4 | 5.8 |
| 2013 | 5.2 | 5.1 | 5.3 | 4.9 | 5.2 | 4.9 | 5.3 | 5.0 | 4.8 | 4.9 | 4.8 | 5.0 | 5.0 |
| 2014 | 5.1 | 5.2 | 5.2 | 5.1 | 5.1 | 5.3 | 5.0 | 4.8 | 5.0 | 4.8 | 4.9 | 4.4 | 5.0 |
| 2015 | 4.4 | 4.3 | 4.5 | 4.5 | 4.2 | 4.4 | 4.4 | 4.5 | 4.5 | 4.2 | 4.4 | 4.5 | 4.5 |
| 2016 | 4.3 | 4.2 | 4.2 | 4.2 | 4.0 | 4.0 | 4.1 | 3.9 | 4.1 | 4.1 | 3.9 | 4.2 | 4.1 |
| 2017 | 4.5 | 4.4 | 4.4 | 4.4 | 4.3 | 4.2 | 4.3 | 4.5 | 4.4 | 4.5 | 4.5 | 4.5 | 4.4 |
| 2018 | 4.5 | 4.4 | 4.3 | 4.5 | 4.3 | 4.5 | 4.3 | 4.3 | 4.3 | 4.5 | 4.3 | 4.2 | 4.4 |
| 2019 | 4.2 | 4.0 | 4.0 | 3.7 | 4.1 | 3.8 | 4.1 | 3.9 | 4.0 | 4.1 | 3.9 | 4.0 | 4.0 |
| 2020 | 3.9 | 4.0 | 4.0 | 3.6 | 3.3 | 3.2 | 3.4 | 3.2 | 3.3 | 3.5 | 3.4 | 3.6 | 3.5 |
| 2021 | 3.6 | 3.7 | 3.8 | 3.7 | 3.7 | 4.0 | 4.1 | 4.3 | 4.5 | 4.8 | 4.9 | 4.8 | 4.2 |
| 2022 | 4.9 | 5.1 | 5.8 | 5.5 | 5.3 | 5.7 | 5.9 | 5.6 | 5.4 | 5.6 | 6.5 | 6.0 | 5.6 |
| 2023 | 5.3 | 5.3 | 5.6 | 5.3 | 5.2 | 5.6 | 5.6 | 5.4 | 5.2 | 5.3 | 5.4 | 5.3 | 5.4 |
| 2024 | 5.1 | 5.0 | 4.9 | 5.2 | 4.9 | 4.9 | 5.1 | 5.0 | 4.7 | 4.7 | 4.7 | 4.8 | 4.9 |
| 2025 | 5.0 | 4.6 | 4.7 | 4.8 | 4.6 | 4.7 | |||||||
| Monthly Average | 4.8 | 4.7 | 4.9 | 4.8 | 4.8 | 4.8 | 4.9 | 4.8 | 4.7 | 4.8 | 4.8 | 4.8 | 4.8 |
| Overall: Roy Morgan Inflation Expectations Average: 4.8 | |||||||||||||
The Roy Morgan Consumer Confidence Report – Including Inflation Expectations
To learn more about the trends for Inflation Expectations as well as Consumer Confidence for different segments and demographics throughout the Australian community, purchase the Roy Morgan Consumer Confidence Monthly Report.
RBA interest rates changes during the time-period measured: 2010-2025.
RBA – Interest rate increasing cycle (2010):
2010
April 2010: +0.25% to 4.25%; May 2010: +0.25% to 4.75%, November 2010: +0.25% to 5%.
RBA – Interest rate cutting cycle (2011-2013, 2015-2016 & 2019-2020):
2011 – 2013
November 2011: -0.25% to 4.5%; December 2011: -0.25% to 4.25%; May 2012: -0.5% to 3.75%;
June 2012: -0.25% to 3.5%; October 2012: -0.25% to 3.25%; December 2012: -0.25% to 3%;
May 2013: -0.25% to 2.75%; August 2013: -0.25% to 2.5%.
2014
There were no RBA interest rate changes during 2014.
2015 – 2016
February 2015: -0.25% to 2.25%; May 2015: -0.25% to 2%; May 2016: -0.25% to 1.75%;
August 2016: -0.25% to 1.5%.
2017 – 2018
There were no RBA interest rate changes during 2017-18.
2019 – 2020
June 2019: -0.25% to 1.25%; July 2019: -0.25% to 1%; October 2019: -0.25% to 0.75%;
March 4, 2020: -0.25% to 0.5%, March 20, 2020: -0.25% to 0.25% & November 6, 2020: -0.15% to 0.1%.
RBA – Interest rate increasing cycle (2022-23):
2022
May 2022: +0.25% to 0.35%, June 2022: +0.5% to 0.85%; July 2022: +0.5% to 1.35%;
August 2022: +0.5% to 1.85%; September 2022: +0.5% to 2.35%; October 2022: +0.25% to 2.6%; November 2022: +0.25% to 2.85% and December 2022: +0.25% to 3.1%.
2023
February 2023: +0.25% to 3.35%; March 2023: +0.25% to 3.6%; May 2023: +0.25% to 3.85%;
June 2023: +0.25% to 4.10%; November 2023: +0.25% to 4.35%.
2024
There were no RBA interest rate changes during 2024.
RBA – Interest rate cutting cycle (2025):
2025
February 2025: -0.25% to 4.10%; May 2025: -0.25% to 3.85%.
Margin of Error
The margin of error to be allowed for in any estimate depends mainly on the number of interviews on which it is based. Margin of error gives indications of the likely range within which estimates would be 95% likely to fall, expressed as the number of percentage points above or below the actual estimate. Allowance for design effects (such as stratification and weighting) should be made as appropriate.
| Sample Size | Percentage Estimate |
| 40% – 60% | 25% or 75% | 10% or 90% | 5% or 95% | |
| 1,000 | ±3.0 | ±2.7 | ±1.9 | ±1.3 |
| 5,000 | ±1.4 | ±1.2 | ±0.8 | ±0.6 |
| 7,500 | ±1.1 | ±1.0 | ±0.7 | ±0.5 |
| 10,000 | ±1.0 | ±0.9 | ±0.6 | ±0.4 |
| 20,000 | ±0.7 | ±0.6 | ±0.4 | ±0.3 |
| 50,000 | ±0.4 | ±0.4 | ±0.3 | ±0.2 |


