Work from Home: Another Great Australian Divide

New research from Roy Morgan highlights a clear divide across Australia’s 150 federal electorates. Nationwide, 47% of working electors, around 5.94 million Australians, work from home at least some of the time. But this flexibility is concentrated in just 45 electorates. In the remaining 105 seats, the majority of working electors continue to work in-person.
The highest work from home electorates are concentrated in Australia’s inner-cities: Sydney (Labor, 67%), Wentworth (Independent, 66%), Bennelong (Labor, 65%), Kooyong (Independent, 65%) and Grayndler (Labor, 62%) lead the nation.
These affluent electorates are dominated by professional white-collar workers and are held by Labor or high-profile Independents.
The electorates with the lowest levels of working from home are found in large regional and remote electorates, where on-site industries dominate. Mallee (Nationals, 31%), Durack (Liberal, 31%), Forrest (Liberal, 29%), Lingiari (Labor, 28%) and Gippsland (Nationals, 28%). Geography and industry combine to make in-person work the overwhelming norm in these seats.
% of working electors who work from home at least some of the time
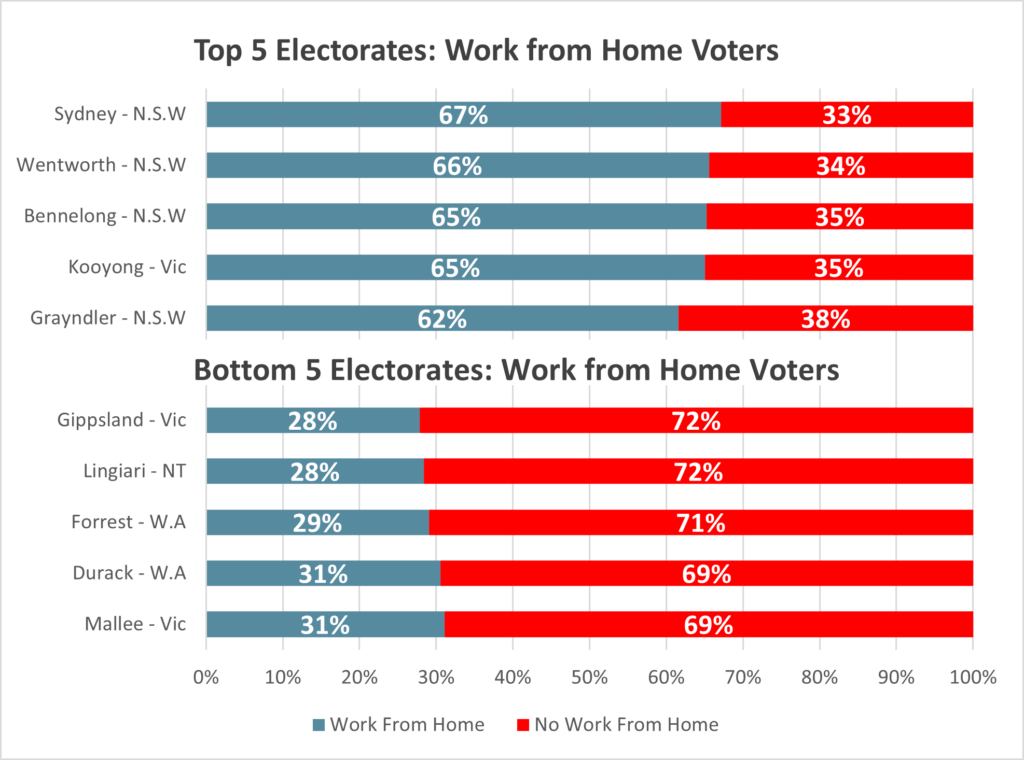
Source: Roy Morgan Single Source: Base: Employed Australian Electors, Aged 18+ between July 2024 to June 2025 (n=36,606).
The Great Divide: Remote Work is Concentrated in Australia's South-East
New South Wales and Victoria account for the bulk of electorates where working from home is the norm: NSW has 21 electorates where a majority work from home, while Victoria has 18. Together, that’s 39 of the 45 majority-WFH electorates nationwide – and another two of these electorates are located in Canberra in the Australian Capital Territory (ACT).
The remaining four electorates are the isolated urban exceptions in Queensland, South Australia, Tasmania and Western Australia which each have a single electorate where a majority work from home: Ryan (QLD, Greens, 50%), Sturt (SA, Labor, 53%), Clark (TAS, Independent, 50%) and Curtin (WA, Independent, 50%).
Of the two Northern Territory electorates, neither records a majority who work from home.
Work From Home & Fully On-Site Electorates by States and Territories
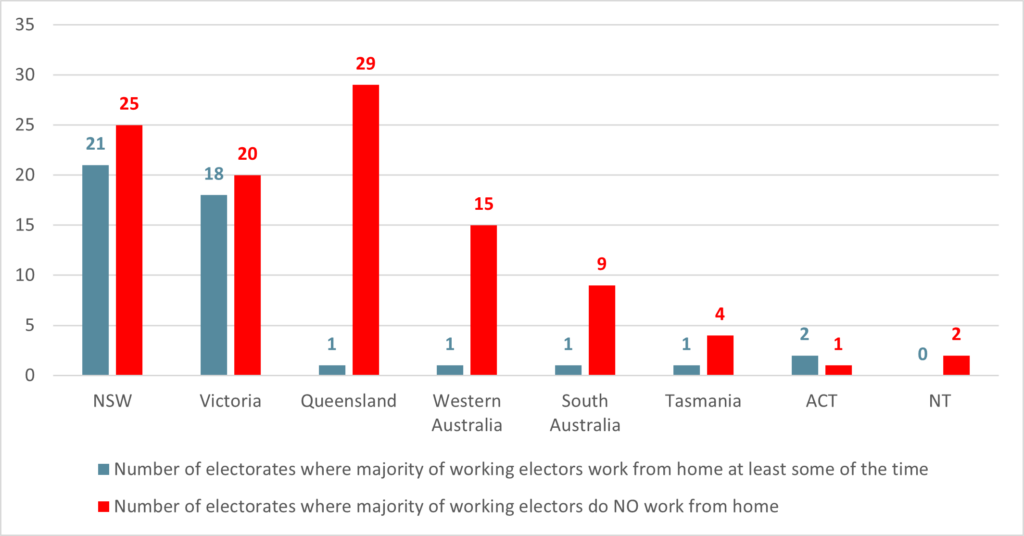
Source: Roy Morgan Single Source: Base: Employed Australian Electors, Aged 18+ between July 2024 to June 2025 (n=36,606).
Work-From-Home Voters: A Labor Stronghold
Among the 45 electorates where a majority work from home, Labor dominates with 30 seats, reflecting its strength in metropolitan hubs where hybrid work is most entrenched. Independents hold 7 electorates, mainly affluent inner-city areas like Wentworth, Warringah, Kooyong, Curtin and Clark, highlighting strong work from home patterns in professional urban centres. The Liberal Party holds 7 seats, a smaller but still notable share in city-based electorates, while the Greens hold just one, Ryan in Queensland.
Overall, the data confirms that working from home is overwhelmingly concentrated in Labor’s metropolitan heartland, with independents and a handful of Liberal and Green seats forming the outliers.
Roy Morgan CEO Michele Levine says:

“Roy Morgan’s new work from home research exposes a great Australian divide in how we work: 47% of working electors, around 5.94 million people, work from home at least some of the time, but that flexibility is concentrated in just 45 of the nation’s 150 electorates
“Affluent inner-city seats such as Sydney where 67% of workers work from home, Wentworth (66%), Bennelong (65%), Kooyong (65%) and Grayndler (62%), Prime Minister Anthony Albanese’s seat, lead the way, while large regional and remote electorates like Mallee (31%), Durack (31%), Forrest (29%), Lingiari (28%) and Gippsland (28%) remain overwhelmingly entirely on-site. The work from home phenomenon is strongest in New South Wales and Victoria, which together contain 39 of the 45 majority-WFH electorates, leaving only isolated urban exceptions across the rest of the country.
“Among these ‘45-majority WFH electorates,’ Labor dominates with 30 seats, reflecting its strength in metropolitan hubs where hybrid work is most entrenched. Independents hold seven, primarily affluent inner-city areas, while the Liberal Party also holds seven, and the Greens just one, highlighting how remote work is overwhelmingly concentrated in Labor’s metropolitan heartland, with only a few city-based exceptions.
“These findings build on last week’s data, showing higher work-from-home rates in CBDs, larger workplaces, and higher-income brackets, highlighting how work type, workplace size, and earnings shape flexibility. It’s a complex issue, reflecting a deep divide between urban and regional communities, different industries, and the varying opportunities Australians have to work from home.”
Roy Morgan interviewed a representative sample of 36,606 employed Australian electors between July 2024 and June 2025. The definition for ‘Working From Home’ includes Employed/ Self-Employed people who work from home either paid or unpaid.
Roy Morgan’s ‘Work From Home’ research can be further analysed by employment type (paid, unpaid, self-employed), ANZSCO occupation, workplace location, media consumption, demographics, and more.
For comments or more information about Roy Morgan’s data please contact Andrew Calvert-Jones or Julian McCrann for more details.
Reports available for sale:
The latest Roy Morgan data is available on the Roy Morgan Online Store. It provides demographic breakdowns for Age, Sex, State, Region (Capital Cities/ Country), Generations, Lifecycle, Socio-Economic Scale, Work Status, Occupation, Home Ownership, Voting Intention, Roy Morgan Value Segments, Helix Personas, Media Consumption, and more
Related Research:
About Roy Morgan
Roy Morgan is Australia’s largest independent Australian research company, with offices in each state, as well as in the U.S. and U.K. A full-service research organisation, Roy Morgan has over 80 years’ experience collecting objective, independent information on consumers.
Margin of Error
The margin of error to be allowed for in any estimate depends mainly on the number of interviews on which it is based. Margin of error gives indications of the likely range within which estimates would be 95% likely to fall, expressed as the number of percentage points above or below the actual estimate. Allowance for design effects (such as stratification and weighting) should be made as appropriate.
| Sample Size | Percentage Estimate |
| 40% – 60% | 25% or 75% | 10% or 90% | 5% or 95% | |
| 1,000 | ±3.0 | ±2.7 | ±1.9 | ±1.3 |
| 5,000 | ±1.4 | ±1.2 | ±0.8 | ±0.6 |
| 7,500 | ±1.1 | ±1.0 | ±0.7 | ±0.5 |
| 10,000 | ±1.0 | ±0.9 | ±0.6 | ±0.4 |
| 20,000 | ±0.7 | ±0.6 | ±0.4 | ±0.3 |
| 50,000 | ±0.4 | ±0.4 | ±0.3 | ±0.2 |


