ANZ-Roy Morgan New Zealand Consumer Confidence lifted 3.1 points from 98.4 to 101.5 in December, the highest level since September 2021
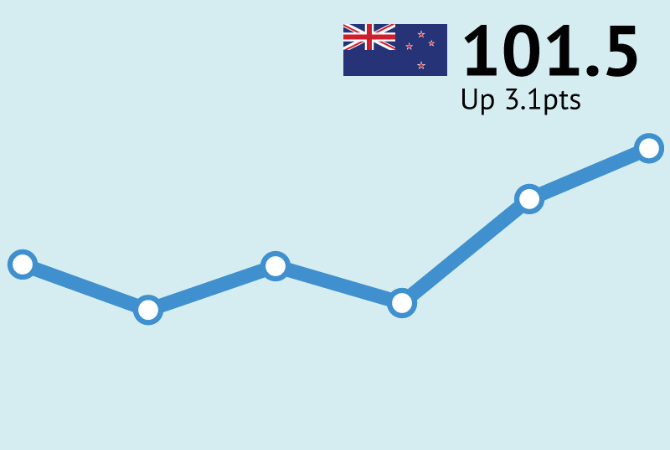
A brighter end to the year
- ANZ-Roy Morgan New Zealand Consumer Confidence lifted 3.1 points from 98.4 to 101.5 in December, the highest level since September 2021.
- The proportion of households thinking it’s a good time to buy a major household item (the best retail indicator) rose 8 points to -1. This indicator hasn’t been positive in more than four years but is knocking on the door.
- Inflation expectations eased from 5.2% to 4.6%, consistent with easing food price inflation.
Turning to the detail (see charts on page 4 of the linked PDF):
- The future conditions index made up of forward-looking questions lifted from 106.8 to 108.9, the highest level since July 2021. The current conditions index rose from 86.0 to 90.4, the highest in a year but still a subdued level.
- Net perceptions of current personal financial situations (better or worse off than last year) rose 1 point to -18%, still very soft, with just over a quarter, 26%, up 1% point, saying they are 'better off' financially than this time last year compared to 44% (unchanged) who say they are now 'worse off'.
- However, a net 22% of respondents expect to be better off this time next year, up 1 point to the highest level since April which includes an unchanged 43% who say they expect to be 'better off' financially this time next year compared to just over a fifth, 21% (down 1% point), who expect to be 'worse off'.
- A net 1% think it’s a bad time to buy a major household item, still fairly weak, but the improvement is consistent with lifting card spending with two-fifths of respondents, 40%, down 4% points, who say it's a 'bad time to buy' major household items compared to 39% (up 4% points) who say it's a 'good time to buy' major household items.
- Perceptions regarding the economic outlook over the next 12 months lifted 3 points to -6%. That’s the highest read since August 2021, but that says more about how weak it’s been since than about how strong it is now, given it’s still negative. The 5-year-ahead measure rose 2 points to +11%.
- House price inflation expectations lifted from 3.8% to 4.0%, the highest level since February 2024. Wellington continues to drag the chain (2.5%).
- Two-year-ahead CPI inflation expectations eased from 5.2% to 4.6%, close to food price inflation (4.7%), but much higher than CPI inflation (3%). In recent years there has been a strong negative correlation between inflation expectations and consumer confidence.
Figure 2 of the linked PDF shows the net percentage of consumers saying it’s a good time to buy a major item split by whether the respondent has a mortgage or not (the latter group being a mix of those who have paid a mortgage off, and renters). Mortgage holders have had a bigger swing in willingness to spend, understandably, as interest rates have cycled. It will be interesting to see in January whether the recent change in direction in interest rates affects this sentiment, or whether the RBNZ Governor’s reassuring words about interest rates staying low for a considerable period, alongside brighter economic headlines, see willingness to spend continue to lift
The improvement was driven by the North Island this month, but Wellington continues to drag this chain (figure 3 of the linked PDF).
Check out the latest data of ANZ-Roy Morgan New Zealand Consumer Confidence here: ANZ-Roy Morgan New Zealand Consumer Confidence
For comments or more information please contact:
Roy Morgan - Enquiries
Office: +61 (03) 9224 5309
askroymorgan@roymorgan.com
Margin of Error
The margin of error to be allowed for in any estimate depends mainly on the number of interviews on which it is based. Margin of error gives indications of the likely range within which estimates would be 95% likely to fall, expressed as the number of percentage points above or below the actual estimate. Allowance for design effects (such as stratification and weighting) should be made as appropriate.
| Sample Size | Percentage Estimate |
| 40% – 60% | 25% or 75% | 10% or 90% | 5% or 95% | |
| 1,000 | ±3.0 | ±2.7 | ±1.9 | ±1.3 |
| 5,000 | ±1.4 | ±1.2 | ±0.8 | ±0.6 |
| 7,500 | ±1.1 | ±1.0 | ±0.7 | ±0.5 |
| 10,000 | ±1.0 | ±0.9 | ±0.6 | ±0.4 |
| 20,000 | ±0.7 | ±0.6 | ±0.4 | ±0.3 |
| 50,000 | ±0.4 | ±0.4 | ±0.3 | ±0.2 |


