Small lift in ANZ-Roy Morgan New Zealand Consumer Confidence in September
Key points
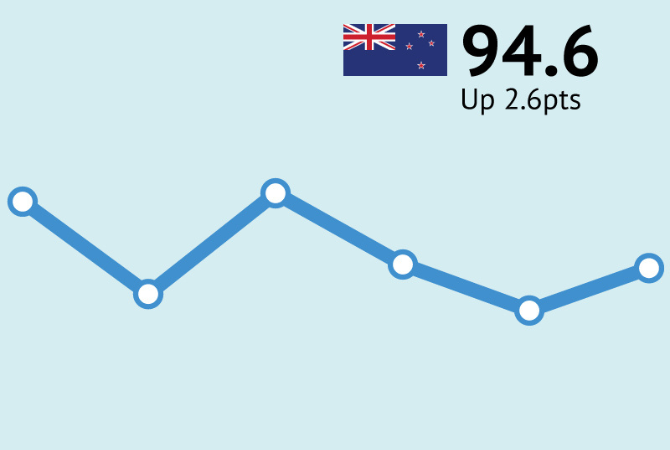
• ANZ-Roy Morgan New Zealand Consumer Confidence rose from 92.0 to 94.6 in September, unwinding the fall seen last month. However, Confidence was markedly lower in the days following the release of the very weak Q2 GDP data.
• The proportion of households thinking it’s a good time to buy a major household item (the best retail indicator) rose 1 point to -11.
• Inflation expectations were steady at 4.8%
Turning to the detail (see charts on page 4 of the linked PDF):
• The future conditions index made up of forward-looking questions was all but unchanged at 99.0. The current conditions index jumped 6 points to 88.1.
• Perceptions of current personal financial situations (better or worse off than last year) lifted 11 points to -13% with 32% (up 10% points) of New Zealanders saying they are 'better off' financially than this time a year ago compared to 44% (down 2% points) who say they are 'worse off' financially. That’s not high, but for context, this question hasn’t been higher than a net figure of -12% since early 2022.
• A net 14% of respondents expect to be better off this time next year with 43% (up 4% points) expecting to be 'better off' financially this time next year compared to 29% (up 3% points) expecting to be 'worse off' financially, a net gain of 1 point.
• A net 11% of respondents think it’s a bad time to buy a major household item with 46% (up 1% point) saying it's a 'bad time to buy' major household items compared to only 35% (up 2% points) who say it's a 'good time to buy' major household items, suggesting caution continues to prevail.
• Perceptions regarding the economic outlook over the next 12 months fell 3 points to -23%. However, the five-year ahead measure lifted 3 points to +6%.
• House price inflation expectations over the next two years dropped from 3.0% to 2.5%, the lowest since July 2024.
• Two-year-ahead CPI inflation expectations were unchanged at 4.8%. Given food price inflation is running at 5%, it’s unsurprising that household inflation expectations are significantly higher than official headline CPI inflation
Looking at the weekly data as the month went on, as figure 2 in the linked PDF shows, there was a sharp drop in confidence following the release of the weak Q2 GDP data. The data preceding the GDP release averaged 96, while the responses that came in afterwards averaged just 77. It’s important to note that the latter sample is very small (only 60 people, 6% of the sample), so the uncertainty about whether this is an accurate estimate of the national mood is high. Indeed, statistically it’s only just significantly different from the rest of the data, even though the spot estimate looks so dramatically different. So take it with a large grain of salt. But it’s entirely plausible there could have been a big impact, as a similar thing happened in early 2024, with a sharp fall in confidence following the release of GDP data showing a recession (that was subsequently revised away, ironically).
The glass-half-full interpretation is that confidence probably would have lifted by more were it not for the GDP headlines. The glass-half-empty view is that confidence has probably taken a hit. How long the dampening impact on confidence might last will depend partly on whether the tenor of the data flow turns sluggishly or enthusiastically higher from here.
Check out the latest data of ANZ-Roy Morgan New Zealand Consumer Confidence here: ANZ-Roy Morgan New Zealand Consumer Confidence
For comments or more information please contact:
Roy Morgan - Enquiries
Office: +61 (03) 9224 5309
askroymorgan@roymorgan.com
Margin of Error
The margin of error to be allowed for in any estimate depends mainly on the number of interviews on which it is based. Margin of error gives indications of the likely range within which estimates would be 95% likely to fall, expressed as the number of percentage points above or below the actual estimate. Allowance for design effects (such as stratification and weighting) should be made as appropriate.
| Sample Size | Percentage Estimate |
| 40% – 60% | 25% or 75% | 10% or 90% | 5% or 95% | |
| 1,000 | ±3.0 | ±2.7 | ±1.9 | ±1.3 |
| 5,000 | ±1.4 | ±1.2 | ±0.8 | ±0.6 |
| 7,500 | ±1.1 | ±1.0 | ±0.7 | ±0.5 |
| 10,000 | ±1.0 | ±0.9 | ±0.6 | ±0.4 |
| 20,000 | ±0.7 | ±0.6 | ±0.4 | ±0.3 |
| 50,000 | ±0.4 | ±0.4 | ±0.3 | ±0.2 |


