


ANZ-Roy Morgan New Zealand Consumer Confidence virtually unchanged in September at 97.6

Trudging along
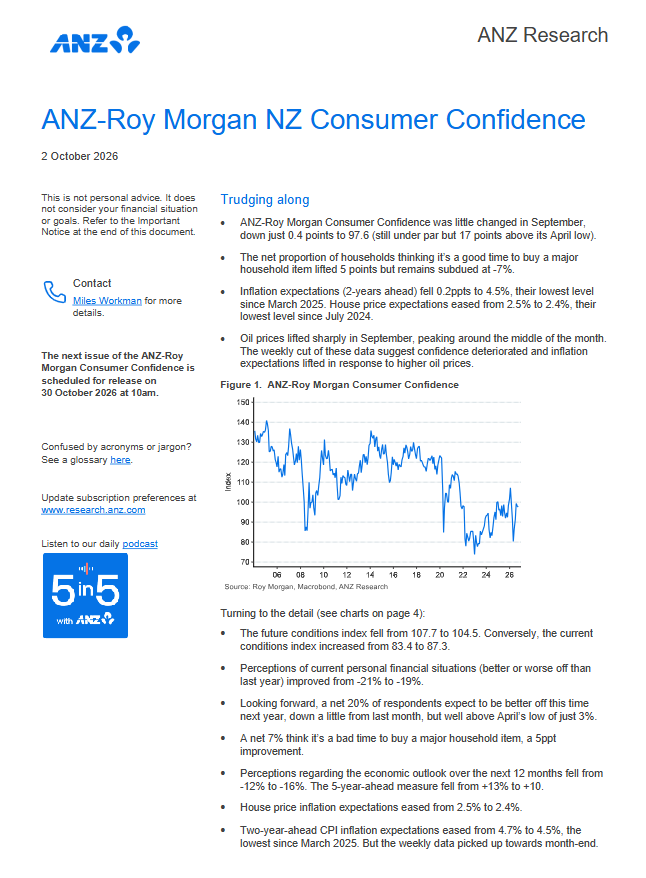
- ANZ-Roy Morgan New Zealand Consumer Confidence was virtually unchanged in September, down just 0.4 points to 97.6, still under par but 17 points above its April low.
- The net proportion of households thinking it’s a good time to buy a major household item rose 5 points but remains subdued at -7%.
- Inflation expectations (2-years ahead) fell 0.2ppts to 4.5%, their lowest level since March 2025. House price expectations eased from 2.5% to 2.4%, their lowest level since July 2024.
- Oil prices lifted sharply in September, peaking around the middle of the month. The weekly cut of these data suggest confidence deteriorated and inflation expectations lifted in response to higher oil prices.
Turning to the detail (see charts on page 4):
- The future conditions index fell from 107.7 to 104.5. Conversely, the current conditions index increased from 83.4 to 87.3.
- Perceptions of current personal financial situations (better or worse off than last year) improved from -21% to -19% with 25% (unchanged) saying they are 'better off' financially than a year ago compared to 44% (down 2% points) that say they are 'worse off'.
- Looking forward, a net 20% of respondents expect to be better off this time next year, down 2 points from last month but well above April’s low of just 3%.
- A net 7% think it’s a bad time to buy a major household item, a 5-point improvement with 44% (down 3% points) saying it's a 'bad time to buy' major household items compared to 37% (up 2% points) that say it's a 'good time to buy'.
- Net perceptions regarding the economic outlook over the next 12 months fell from -12% to -16%. The 5-year-ahead measure also fell from +13% to +10%.
- House price inflation expectations eased from 2.5% to 2.4%.
- Two-year-ahead CPI inflation expectations eased from 4.7% to 4.5%, the lowest since March 2025.
Oil prices lifted sharply in September, peaking around the middle of the month before partially retracing. Splitting the September data into weekly observations shows headline consumer confidence started the month on a stronger footing than it finished, while inflation expectations ended the month higher. That’s a slightly different signal to the September Business Outlook, which showed a deterioration across almost all of the late-month activity indicators (consistent with consumer confidence), but slightly lower (on average) inflation indicators in the late month sample. However, it needs to be borne in mind that each cut of the monthly sample produces a rougher estimate of the “truth”.
Margin of Error
The margin of error to be allowed for in any estimate depends mainly on the number of interviews on which it is based. Margin of error gives indications of the likely range within which estimates would be 95% likely to fall, expressed as the number of percentage points above or below the actual estimate. Allowance for design effects (such as stratification and weighting) should be made as appropriate.
| Sample Size | Percentage Estimate |
| 40% – 60% | 25% or 75% | 10% or 90% | 5% or 95% | |
| 1,000 | ±3.0 | ±2.7 | ±1.9 | ±1.3 |
| 5,000 | ±1.4 | ±1.2 | ±0.8 | ±0.6 |
| 7,500 | ±1.1 | ±1.0 | ±0.7 | ±0.5 |
| 10,000 | ±1.0 | ±0.9 | ±0.6 | ±0.4 |
| 20,000 | ±0.7 | ±0.6 | ±0.4 | ±0.3 |
| 50,000 | ±0.4 | ±0.4 | ±0.3 | ±0.2 |


