


Victorian State Voting Intention: Victoria’s Upper House is evenly split between L-NP/One Nation (18 seats) and ALP/Greens (18 seats) with four seats undecided

The race to secure a majority of seats in Victoria’s Upper House is evenly poised with the L-NP Coalition / One Nation set to secure 18 seats, level with the ALP/Greens (18 seats), and the remaining four seats are undecided.
This special Roy Morgan survey was conducted over the three months from July – September 2026, with a representative Victoria-wide cross-section of 2,845 electors with an average of around 360 electors in each of Victoria’s eight Upper House regions.
This interviewing period included the resignation of former Premier Jacinta Allan on Tuesday July 28, the swearing in of Ben Carroll as the new Premier that same day, One Nation’s announcement that Warren Pickering is the leader of One Nation Victoria on Monday August 3, and revelations about Pickering’s past drug use, relationship troubles, driving under the influence convictions, and subsequent redemption after joining the Australian army.
This is a closer result than an earlier SMS Roy Morgan Poll conducted in early August which showed the L-NP Coalition and One Nation securing a majority of 21 seats in Victoria’s Upper House. The changed result is driven by an improved performance from the Greens in recent months.
Victorian Upper House Regions – Predicted Seats by 3 Country Regions & 5 Metropolitan Regions
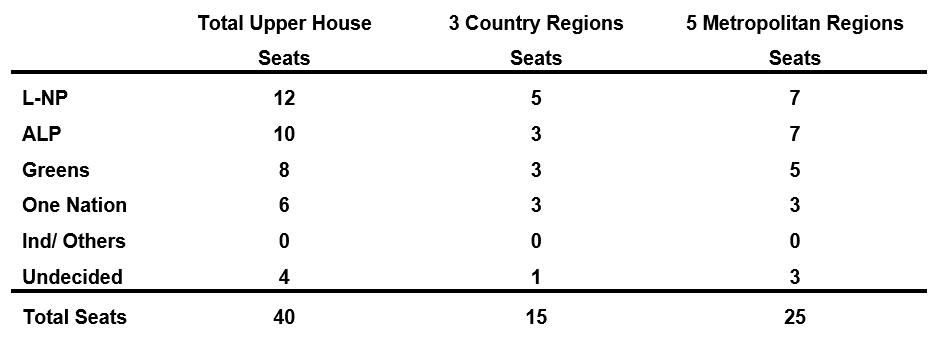
To win a seat in Victoria’s Upper House, a candidate must secure 16.7% of the vote in any given region.
New legislation, passed in the Victorian Parliament in August, abolished Group Voting Tickets (GVTs) in Victoria’s Upper House which means there will be significant preference exhaustion and any party with at least 12% support in a region is projected to secure a seat after the distribution of preferences in this forecast.
This also means a party must record support of at least 29% in any given region to be confident of securing a second Upper House seat in that region.
Right-leaning L-NP Coalition and One Nation and left-leaning ALP and Greens are both set to win 18 seats in Victoria’s Upper House at next month’s Victorian Election
The L-NP Coalition is on track to secure 12 seats (down one seat from now) including two seats in four Upper House Regions: Eastern Victoria (35% support), Northern Victoria (29%), Southern Metropolitan (32.5%), and South-Eastern Metropolitan (30.5%), and one seat in each of the other four regions of Western Victoria (26%), Northern Metropolitan (14.5%), Western Metropolitan (28%), and North-Eastern Metropolitan (25.5%).
The ALP is on track to secure 10 seats (down five seats from now) including two seats in two Upper House Regions: Northern Metropolitan (34.5% support), and North-Eastern Metropolitan (30.5%), and one seat in the six other regions of Eastern Victoria (21%), Northern Victoria (24%), Western Victoria (21%), Southern Metropolitan (23%), Western Metropolitan (24.5%), and South-Eastern Metropolitan (23%).
One Nation is on track to secure six seats (up five seats from now) including one seat in six Upper House Regions: Western Metropolitan (20.5% support), South-Eastern Metropolitan (20.5%), Eastern Victoria (21.5%), Northern Victoria (24%), Western Victoria (24%), and North-Eastern Metropolitan (12.5%).
The Greens are on track to secure eight seats (up four seats from now) including one seat in each of the eight Upper House regions of Northern Metropolitan (26% support), Southern Metropolitan (23%), North-Eastern Metropolitan (19.5%), Western Metropolitan (18%), South-Eastern Metropolitan (16%), Western Victoria (16%), Eastern Victoria (15%), and Northern Victoria (12.5%).
There are a further four other seats which are set to be decided by preference flows in Western Victoria, Northern Metropolitan, Southern Metropolitan, and Western Metropolitan which will determine whether the right-leaning L-NP Coalition and One Nation, or left-leaning ALP and Greens, holds the majority of seats in Victoria’s Upper House after next month’s election.
Victorian Upper House Regions: 3 Country Regions
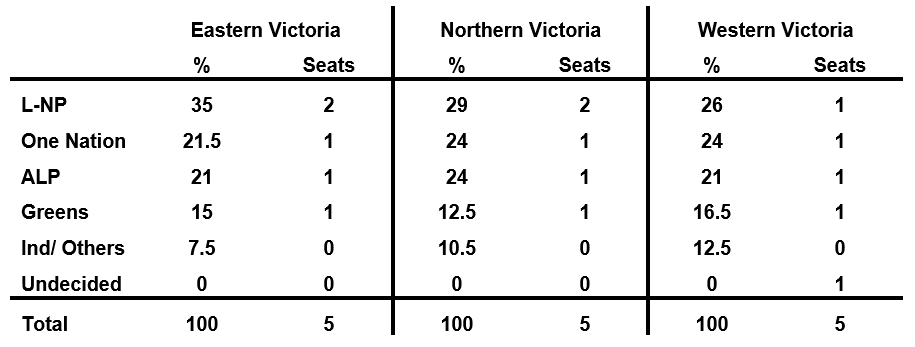
There were an average of 340 electors interviewed in each of the three Country Regions.
Victorian Upper House Regions: Northern, Western & Southern Metropolitan Regions
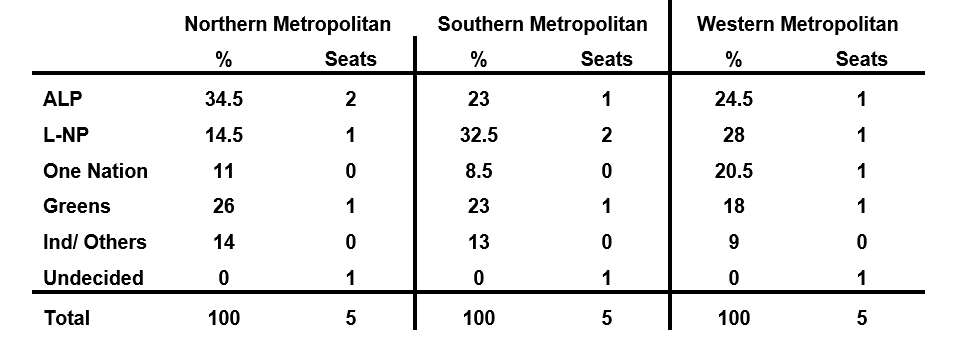
There were an average of 370 electors interviewed in each of the five Metropolitan Regions.
Victorian Upper House Regions: North-Eastern & South-Eastern Metropolitan Regions
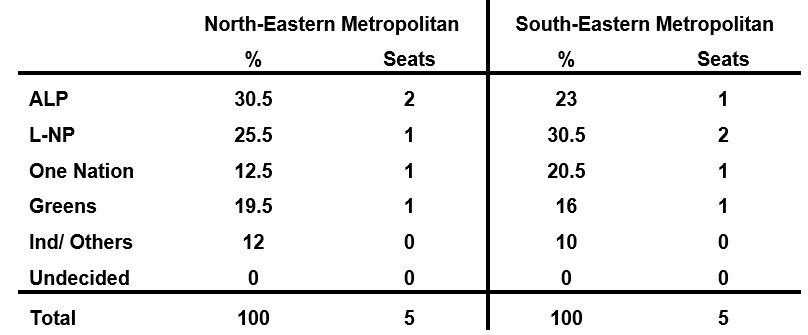
There were an average of 370 electors interviewed in each of the five Metropolitan Regions.
This special Roy Morgan survey of Victorian electors was conducted over the three months from July – September 2026, with a representative Victoria-wide cross-section of 2,845 electors.
Further details will be released in Roy Morgan’s weekly video update presented by Roy Morgan Chief Executive Officer Michele Levine.
In-depth detailed analysis such as by capital cities/country areas, age, gender, Victoria’s eight Upper House regions, occupation, and education is available to subscribers to the Morgan Poll.
To learn more contact Julian McCrann on (03) 9224 5365 or email julian.mccrann@roymorgan.com.
About Roy Morgan
Roy Morgan is Australia’s largest independent Australian research company, with offices in each state, as well as in the U.S. and U.K. A full-service research organisation, Roy Morgan has over 80 years’ experience collecting objective, independent information on consumers.
About Roy Morgan
Roy Morgan is Australia’s largest independent Australian research company, with offices in each state, as well as in the U.S. and U.K. A full-service research organisation, Roy Morgan has over 80 years’ experience collecting objective, independent information on consumers.
Margin of Error
The margin of error to be allowed for in any estimate depends mainly on the number of interviews on which it is based. Margin of error gives indications of the likely range within which estimates would be 95% likely to fall, expressed as the number of percentage points above or below the actual estimate. Allowance for design effects (such as stratification and weighting) should be made as appropriate.
| Sample Size | Percentage Estimate |
| 40% – 60% | 25% or 75% | 10% or 90% | 5% or 95% | |
| 1,000 | ±3.0 | ±2.7 | ±1.9 | ±1.3 |
| 5,000 | ±1.4 | ±1.2 | ±0.8 | ±0.6 |
| 7,500 | ±1.1 | ±1.0 | ±0.7 | ±0.5 |
| 10,000 | ±1.0 | ±0.9 | ±0.6 | ±0.4 |
| 20,000 | ±0.7 | ±0.6 | ±0.4 | ±0.3 |
| 50,000 | ±0.4 | ±0.4 | ±0.3 | ±0.2 |


